
Embed Views into Ops Dashboard
Introduction
Businesses with teams tracking their workers on the move with HyperTrack need feature-rich map-enabled dashboards. Customers need to see live location of their workers. Organizations building ops dashboards and customer centric delivery apps need to customize live tracking UIs to deliver experiences aligned with their use cases, workflow, and branding. Larger enterprises with multiple field teams want to create live tracking views restricted for each team. Moreover, developers want greater control of how to create compelling live tracking use cases for mobile and web without worrying about infrastructure and platform scale.
HyperTrack provides answers to all of the above.
Embed and customize web views for ops
As fleets of devices get tracked throughout the day, their operations managers need a tool to review their teams in their dashboards in both real-time and as well as with detailed historical reports. As the count of assets on the move grow larger, operation managers need scalable dashboards that provide a quick assessment of whereabouts of their teams, grouped based on organizational criteria, such as, for example, team names, their categorization, or geographic regions. They need an ability to see where these devices are at any present moment, review their location history, activity, and tracking status now or in the past. Additionally, for reporting and auditing purposes, they need to export detailed device history data as well as aggregated reports organized per their preferences.
To achieve the ease of use in reviewing large counts of devices on the move, HyperTrack provides restricted view functionality which automatically organizes devices using device metadata set through the SDK or API.
Inline Frames
In order to embed a dashboard into your web application, you need to create embeddable views are implemented with HTML inline frames and require JavaScript to be executed successfully.
Iframes have important properties to be considered during implementation. Please read the following instructions carefully to ensure a seamless integration:
- Iframe size: By default, Iframes are sized with 200 pixels height and 300 pixels width. It is recommended to implement responsiveness using CSS. Here is a sample implementation
- Responsive views: All embeddable views are responsive and the mobile views will be displayed when the Iframe size is below 500 pixels
- Security: When you activate the
sandboxproperty for this Iframe, please includeallow-scripts allow-same-originto ensure successful execution of the JavaScript present in the Views - Compatibility: Please review browser compatibility of IFrame properties you want to use
- Loading times: In order to improve speed, it's recommended to set the iframe's src attribute with JavaScript after the main content is done with loading
## Coding view instructions
const baseUrl = "https://embed.hypertrack.com/tracking"
## This is an example Publishable Key. Please replace it with the key you obtain from the Setup page.
const publishableKey = "rYd51pSVlZkhisUkcQCncp-c5CVxQeRi6s6bAWXM6T76bWwUlaUMlQ"

const metadataObject = {
  vehicle_type: "scooter"
}
const metadataFilter = JSON.stringify(metadataObject)

## Embeddable widget for Get Devices Status by metadata
<iframe width="400px" height="400px" src=`{baseUrl}?metadata_filter={metadataFilter}&publishable_key={publishableKey}` />
Code to embed views in your dashboard
Embed views require the HyperTrack publishable key. Get your publishable key from the Setup page on your HyperTrack dashboard.
## Coding view instructions
const baseUrl = "https://embed.hypertrack.com/tracking"
## This is an example Publishable Key. Please replace it with the key you obtain from the Setup page.
const publishableKey = "rYd51pSVlZkhisUkcQCncp-c5CVxQeRi6s6bAWXM6T76bWwUlaUMlQ"

const metadataObject = {
  vehicle_type: "scooter"
}
const metadataFilter = JSON.stringify(metadataObject)

## Embeddable widget for Get Devices Status by metadata
<iframe width="400px" height="400px" src=`{baseUrl}?metadata_filter={metadataFilter}&publishable_key={publishableKey}` />
Embeddable dashboard views
Aggregate views
Go to Tracking on your HyperTrack dashboard to map all devices that you intend to track. To embed Tracking view experience in your dashboard use the following URL format as shown below:
https://embed.hypertrack.com/tracking?publishable_key={publishable_key}
- Clustered live location of all devices right now
- Day-wise list of all devices you intend to track, classified as active, inactive or disconnected
- Location polyline and movement timeline of each device for the selected day
- Aggregate durations, steps and distances of stops, walks and drives
- Role based views organized and filtered by metadata
Map view of all devices
- The default view shows a map with a list of all devices you intended to track today
- User may select the day and timezone to view devices for
- Devices are grouped by device status
- User may search devices by name or metadata
- Each device shows associated metadata and a status bar with split of stop, walk, drive, inactive and disconnected durations
- Every device that tracked location(s) that day is classified as active for that day
- Devices that were inactive all day have an associated reason and the last updated location timestamp
- Devices that were disconneced all day show the last updated location timestamp
- Clicking on a device will show the day's movement timeline on the map
- User may popout the device history in a new browser window if you prefer
- Users can select the day and timezone for which they want to view the list of devices on a map, and drill down into individual devices and their histories.
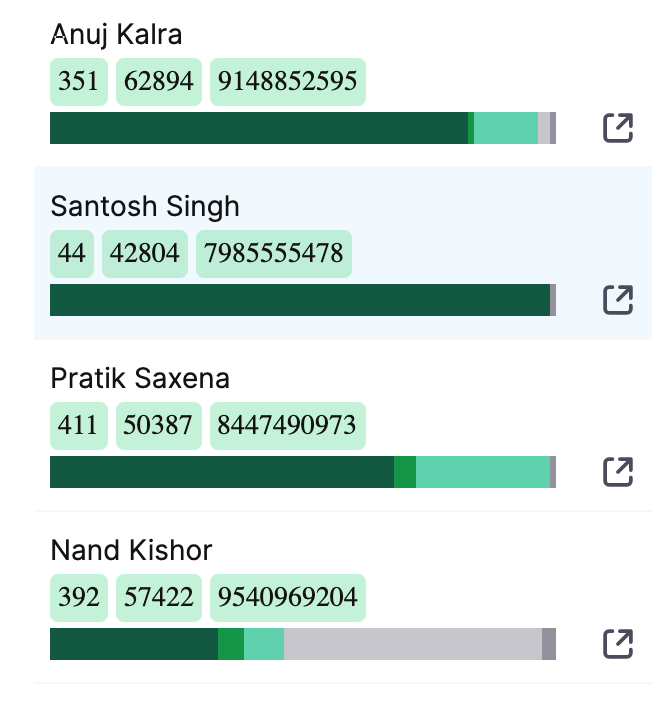
Device status and metadata
Devices in the list show a status bar and metadata for each device. For selected day, the status bar indicates the duration of stop, walk, drive, inactive and disconnected for the device. Metadata shows the values set in the device metadata JSON, and shows the corresponding keys on hover.
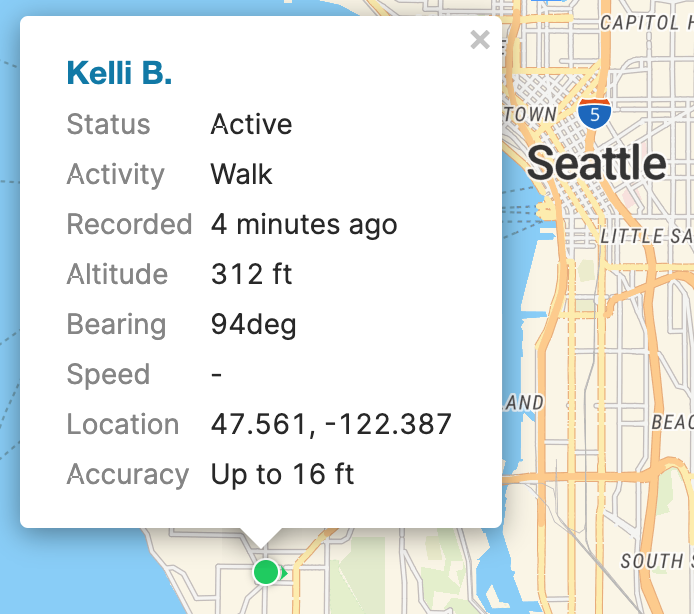
Live location of a device
The view for today shows live location of devices on the map with last known locations. Live locations automatically update in the view as the device moves. Hovering on live location opens a card with the following information:
- Device status: active, inactive or disconnected. Read more here.
- Activity: stop, walk or drive
- Recorded: Timestamp of the location as recorded by the OS
- Altitude: Altitide of the device at that location
- Bearing: Bearing of the device at that location
- Speed: Speed of device at that location
- Location: Latitude, Longitude
- Accuracy: Accuracy of the location
There are additional visual elements to make the live location of other devices come alive in a way that is consistent with on-device views of location in popular mapping apps.
- Live location pulsates if recorded under a minute ago
- Live location shows bearing when the device is moving
- The halo around the live location dot indicates accuracy
Viewing inactive device status
In the dashboard, you may observe inactive device status for your app user's devices in your account as shown in the image below.
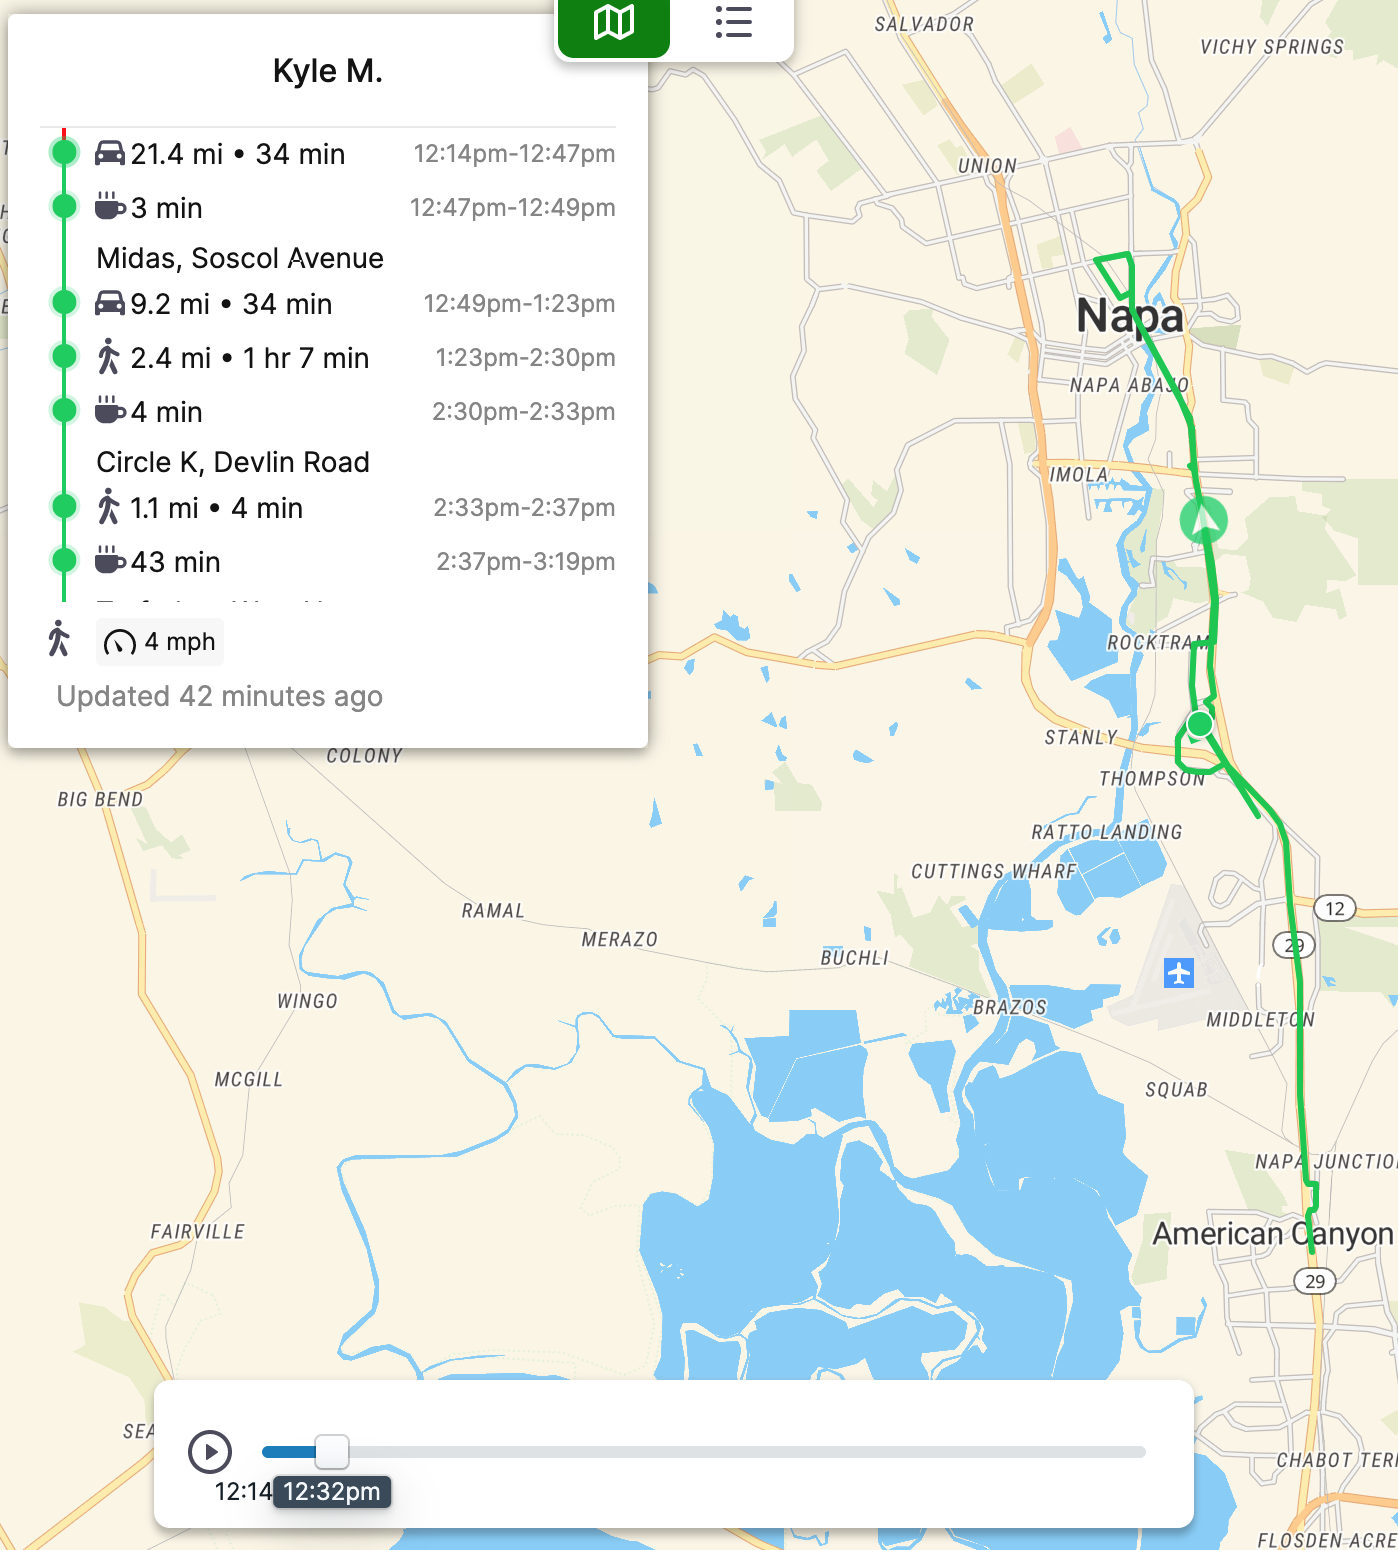
Device timeline
Clicking a device in the list or clicking the dot on the map shows the device timeline.
- Location polyline with replay to drill down where the device was at what point in time
- Movement timeline card organized by activity and outages
- Addresses for stops, distances for drives, and steps for walks
- Option to view or hide the device info and metadata
- If selected day is today and the device is active, ongoing activity, last updated and speed become visible
Trip view
As you have seen form the above, embed_url offers you an ability to create live trip tracking dashboard inside your application and is suited for operations manager usage.
It provides full trip history timeline since the starting point of the trip, an option for exporting a trip summary, with real-time tracking for active trips as well as completed trips full summary data.
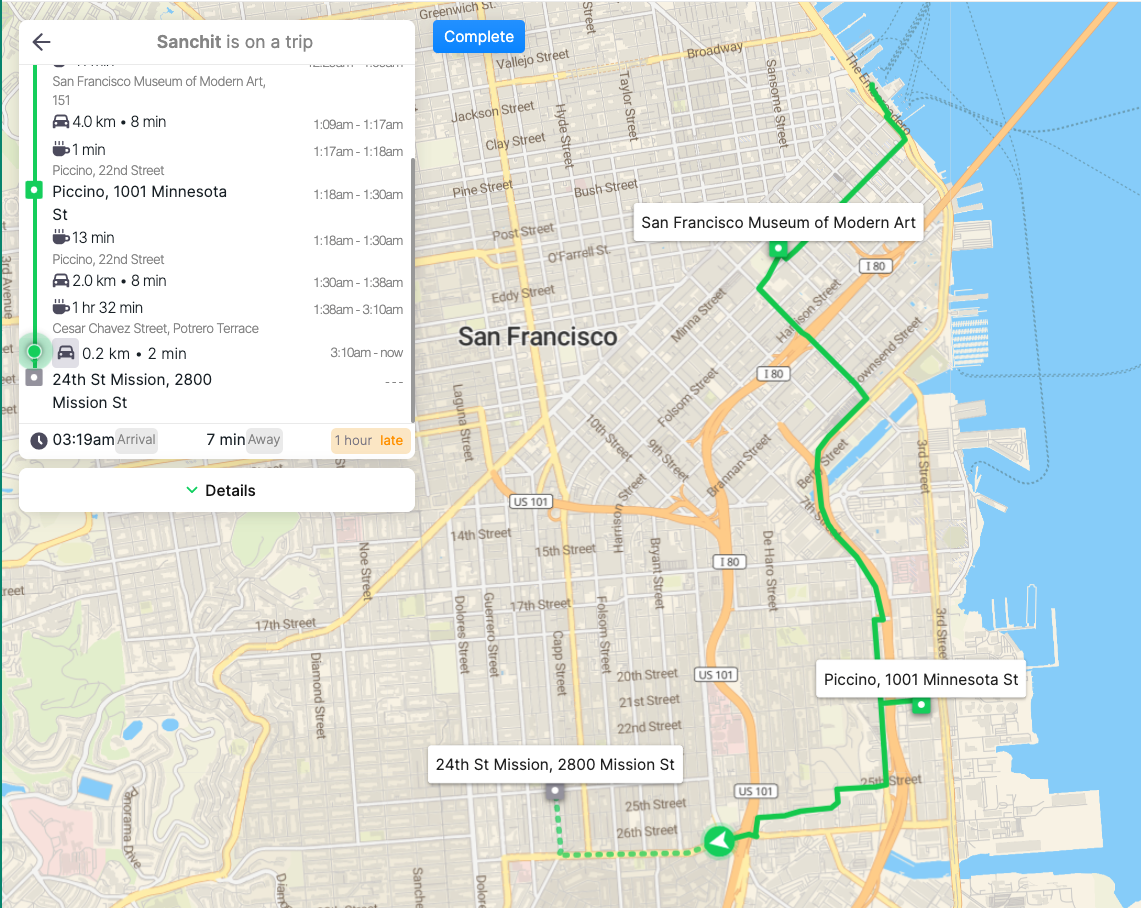
The Trip payload includes the views object. Every trip gets assigned unique URLs to share and embed views of the trip. The URLs will remain active after trip completion. In that case, the views will show a summary of the trip, along with destination marker, start and complete locations, distance, duration, arrival time, device info, trip metadata, and the actual route taken to the destination.
While shareable views are accessible to everyone with the URL, embed views include the HyperTrack publishable key. The embed_URL includes the publishable key and is available to use as-is. That said, your publishable key is available in the Setup page of your HyperTrack dashboard.
The embed URL format is https://embed.hypertrack.com/trips/{trip_id}?publishable_key={publishable_key}
To identify a HyperTrack Trip with your application order, and destination with your order location, please use the metadata object for trip and destination respectively.
App user view
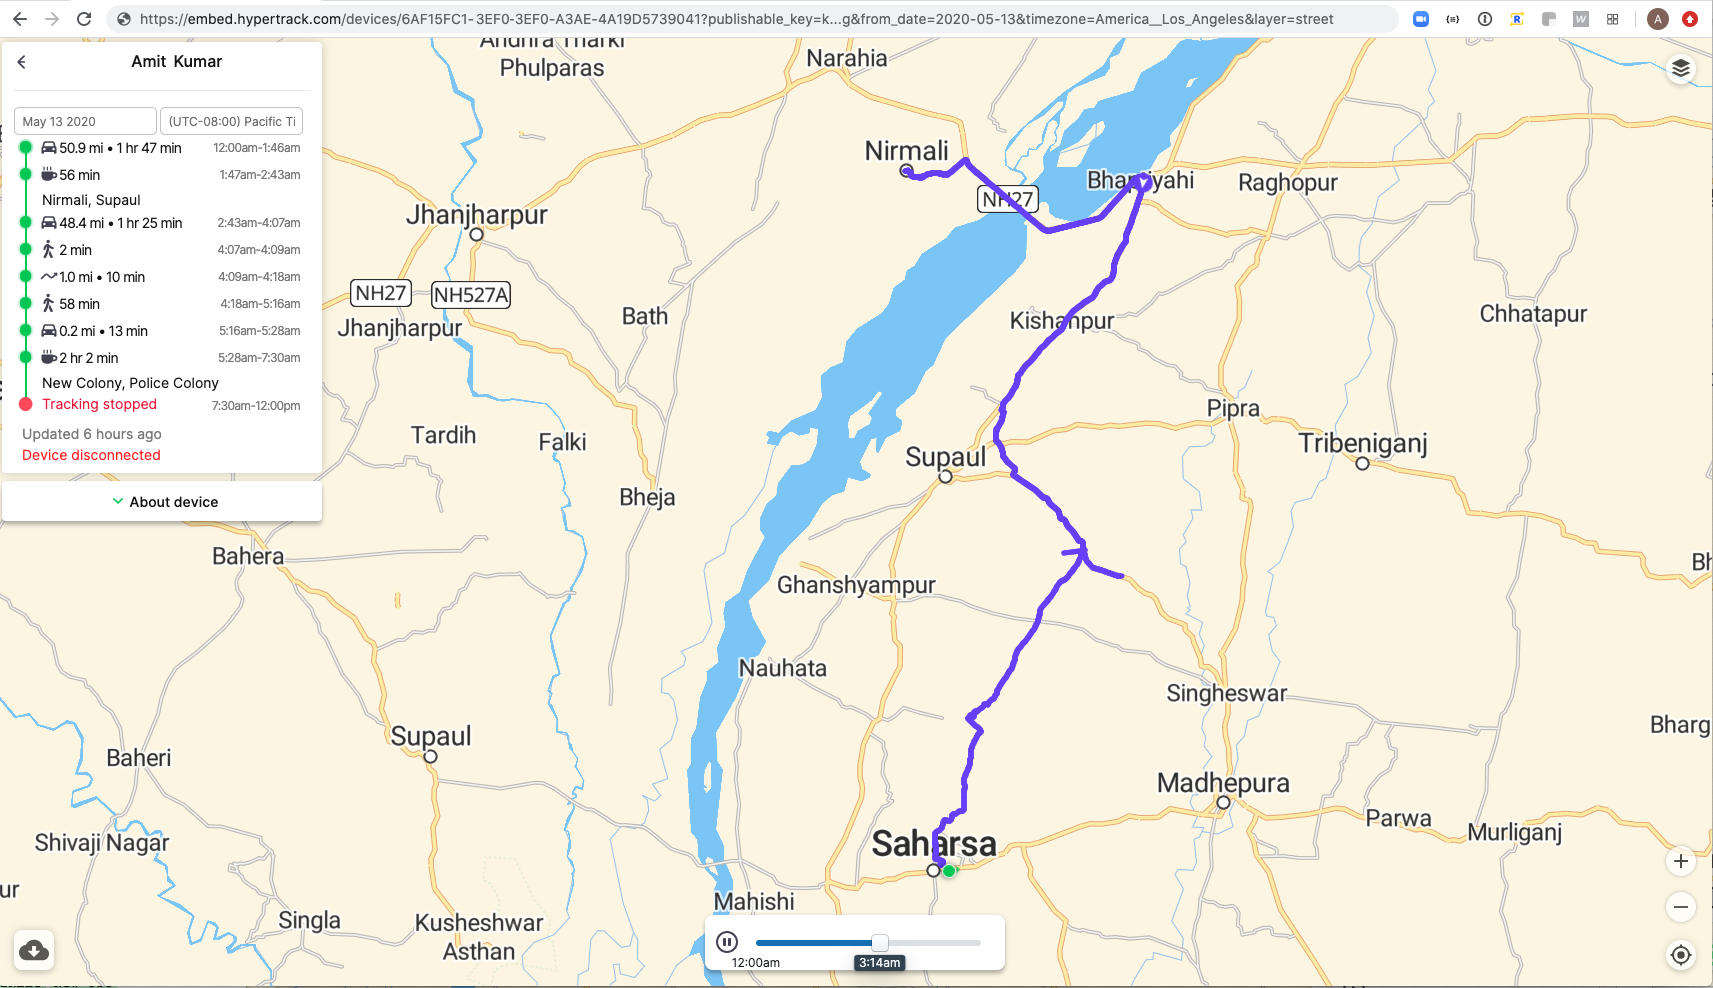
In certain cases, you may decide to create a single device view experience in your dashboard as shown in the image below. The corresponding embed URL would be:
https://embed.hypertrack.com/tracking/{deviceID}?publishable_key={publishable_key}
If you prefer, the Devices API returns embed_url for single device views that you may directly use. This approach allows you to create single device views in your operations dashboard dynamically as you get new devices registered under your HyperTrack account.
Scoreboard view
Embed the Scoreboard view experience in your dashboard with this embed URL would be:
https://embed.hypertrack.com/scoreboard?publishable_key={publishable_key}
Restrict Scoreboard with role based access
You may want to be able to restrict Scoreboard only to devices that are relevant to operation managers responsible for their teams. In order to do this, you may leverage metadata filter URL encoding to embed these dashboards into your web application.
As you navigate role based views, you will notice that the URL contains metadata_filter parameter that contains your current selection.
For example, with this code below:
https://embed.hypertrack.com/scoreboard?publishable_key=...&metadata_filter=%7B%22Zone%22%3A%22East%22%7D
The restricted view will look like this image below with devices filtered for key Zone with value East in their metadata:
Only valid JSON strings can be passed to the URL and your metadata can only have one layer of nesting. For example:
{
  "vehicle": {
    "category": "car"
  }
}
While testing, you can use this linter to validate JSON.
Your browser will most likely encode { } and : special characters, but when distributing embed URLs with a metadata_filter, be sure to encode your link. To read more about URL encoding, please read this guide.
:::
Restrict Scoreboard with region based filtering
You may also want to be able to restrict Scoreboard only to certain regions that you may be interested in. In order to do this, you may leverage region filter URL encoding to embed these dashboards into your web application. An example below demonstrates restricting Scoreboard to United States as the region of choice:
https://embed.hypertrack.com/scoreboard?publishable_key=...®ion_filter=%7B"country"%3A"United+States+of+America"%7D
Insights view
Embed Insights view in your dashboard with this embed URL would be:
https://embed.hypertrack.com/insights?publishable_key={publishable_key}
Restrict Insights with role based access
You may want to be able to restrict Insights only to devices that are relevant to operation managers responsible for their teams. In order to do this, you may leverage metadata filter URL encoding to embed these dashboards into your web application.
As you navigate role based views, you will notice that the URL contains metadata_filter parameter that contains your current selection.
For example, with this code below:
https://embed.hypertrack.com/insights?publishable_key=...&metadata_filter=%7B%22Zone%22%3A%22East%22%7D
The restricted view will look like this image below with devices filtered for key Zone with value East in their metadata:
Only valid JSON strings can be passed to the URL and your metadata can only have one layer of nesting. For example:
{
  "vehicle": {
    "category": "car"
  }
}
While testing, you can use this linter to validate JSON.
Your browser will most likely encode
{ }and:special characters, but when distributing embed URLs with ametadata_filter, be sure to encode your link. To read more about URL encoding, please read this guide.
Restrict Insights with region based filtering
You may also want to be able to restrict Insights only to certain relevant regions. In order to do this, you may leverage region filter URL encoding to embed these dashboards into your web application. An example below demonstrates restricting Insights to United States as the region of choice:
https://embed.hypertrack.com/insights?publishable_key=...®ion_filter=%7B"country"%3A"United+States+of+America"%7D
Restrict views for role based access
You may want to be able to restrict these dashboards only to devices that are relevant to operation managers responsible for their teams. For example, store owners want to see drivers assigned to their stores, foremen want to see whereabouts of their team members, or you are building an ops dashboard for multiple clients and want to create restricted views for each client.
In order to do this, you may leverage metadata filter URL encoding to embed these dashboards into your web application. Embed view URL can contain metadata_filter parameter that contains your current selection.
For example, with this code below:
https://dashboard.hypertrack.com/tracking?publishable_key=...view=devices&metadata_filter=%7B%22hub_id%22%3A%22106%22%7D
The restricted view will look like this image below with devices filtered for key hub_id with value 106 in their metadata:
Only valid JSON strings can be passed to the URL and your metadata can only have one layer of nesting. For example:
{
  "vehicle": {
    "category": "car"
  }
}
Your browser will most likely encode
{ }and:special characters, but when distributing embed URLs with ametadata_filter, be sure to encode your link. To read more about URL encoding, please read this guide.
Secure views with access token
Instead of using a publishable key, you may use OAuth API to obtain a limited use token to secure access to embeddable views.
This token would be unique, short-lived, and restricted.
curl -X POST https://v3.api.hypertrack.com/oauth/token \
  -d "{
        "client_id": "{AccountId}:",
        "client_secret": "{SecretKey}",
        "grant_type": "client_credentials",
        "scope": "*"
      }"
Once this token is obtained, you can use it as follows:
https://dashboard.hypertrack.com/tracking?token=...view=devices&metadata_filter=%7B%22hub_id%22%3A%22106%22%7D
Securely restrict views with access token scope
Use scopes to restrict access to certain pages or assets whenever necessary.
A scope value can be composed as follows:
[read|write|*].[api|embed].[orders|trips|devices].[order_id|trip_id|device_id]
Scope can be defined as * as in access everything allowed but also can be composed as below:
read.embed.ordersallows you to embed views where you can retrieve and display all ordersread.embed.devicesallows you to embed views where you can retrieve and display all devicesread.embed.orders.96f7ec96-402c-47a7-b0a1-eb6b91640a58allows you only to display only this order
To obtain a restricted token to only access a given device_id 00112233-4455-6677-8899-AABBCCDDEEFF, you can use the following example with a limited scope:
curl -X POST https://v3.api.hypertrack.com/oauth/token \
  -d "{
        "client_id": "{AccountId}:",
        "client_secret": "{SecretKey}",
        "grant_type": "client_credentials",
        "scope": "read.embed.devices.00112233-4455-6677-8899-AABBCCDDEEFF"
      }"
Support for scopes with
writeandapivalues will be available in future releases.
Updated 28 days ago