
Introduction
Location AI for Shift Work Automation
HyperTrack helps businesses around the globe automate their field service, shift service and gig work apps with location intelligence. Our APIs and SDKs stitch together workflows across cloud, mobile and mapping technologies so you can get to market fast with low engineering burden and automated operations.
HyperTrack brings visibility to on-ground operations, intelligence to identify risks, flexibility to handling escalations, tools for work validation and reconciliation, metrics to track fleet health and a lot more.
HyperTrack-powered applications span a wide variety of industries including shift work marketplaces, field service management, field sales, on-demand delivery, B2B delivery, ride-sharing and more.
Schedule And Track Your Work
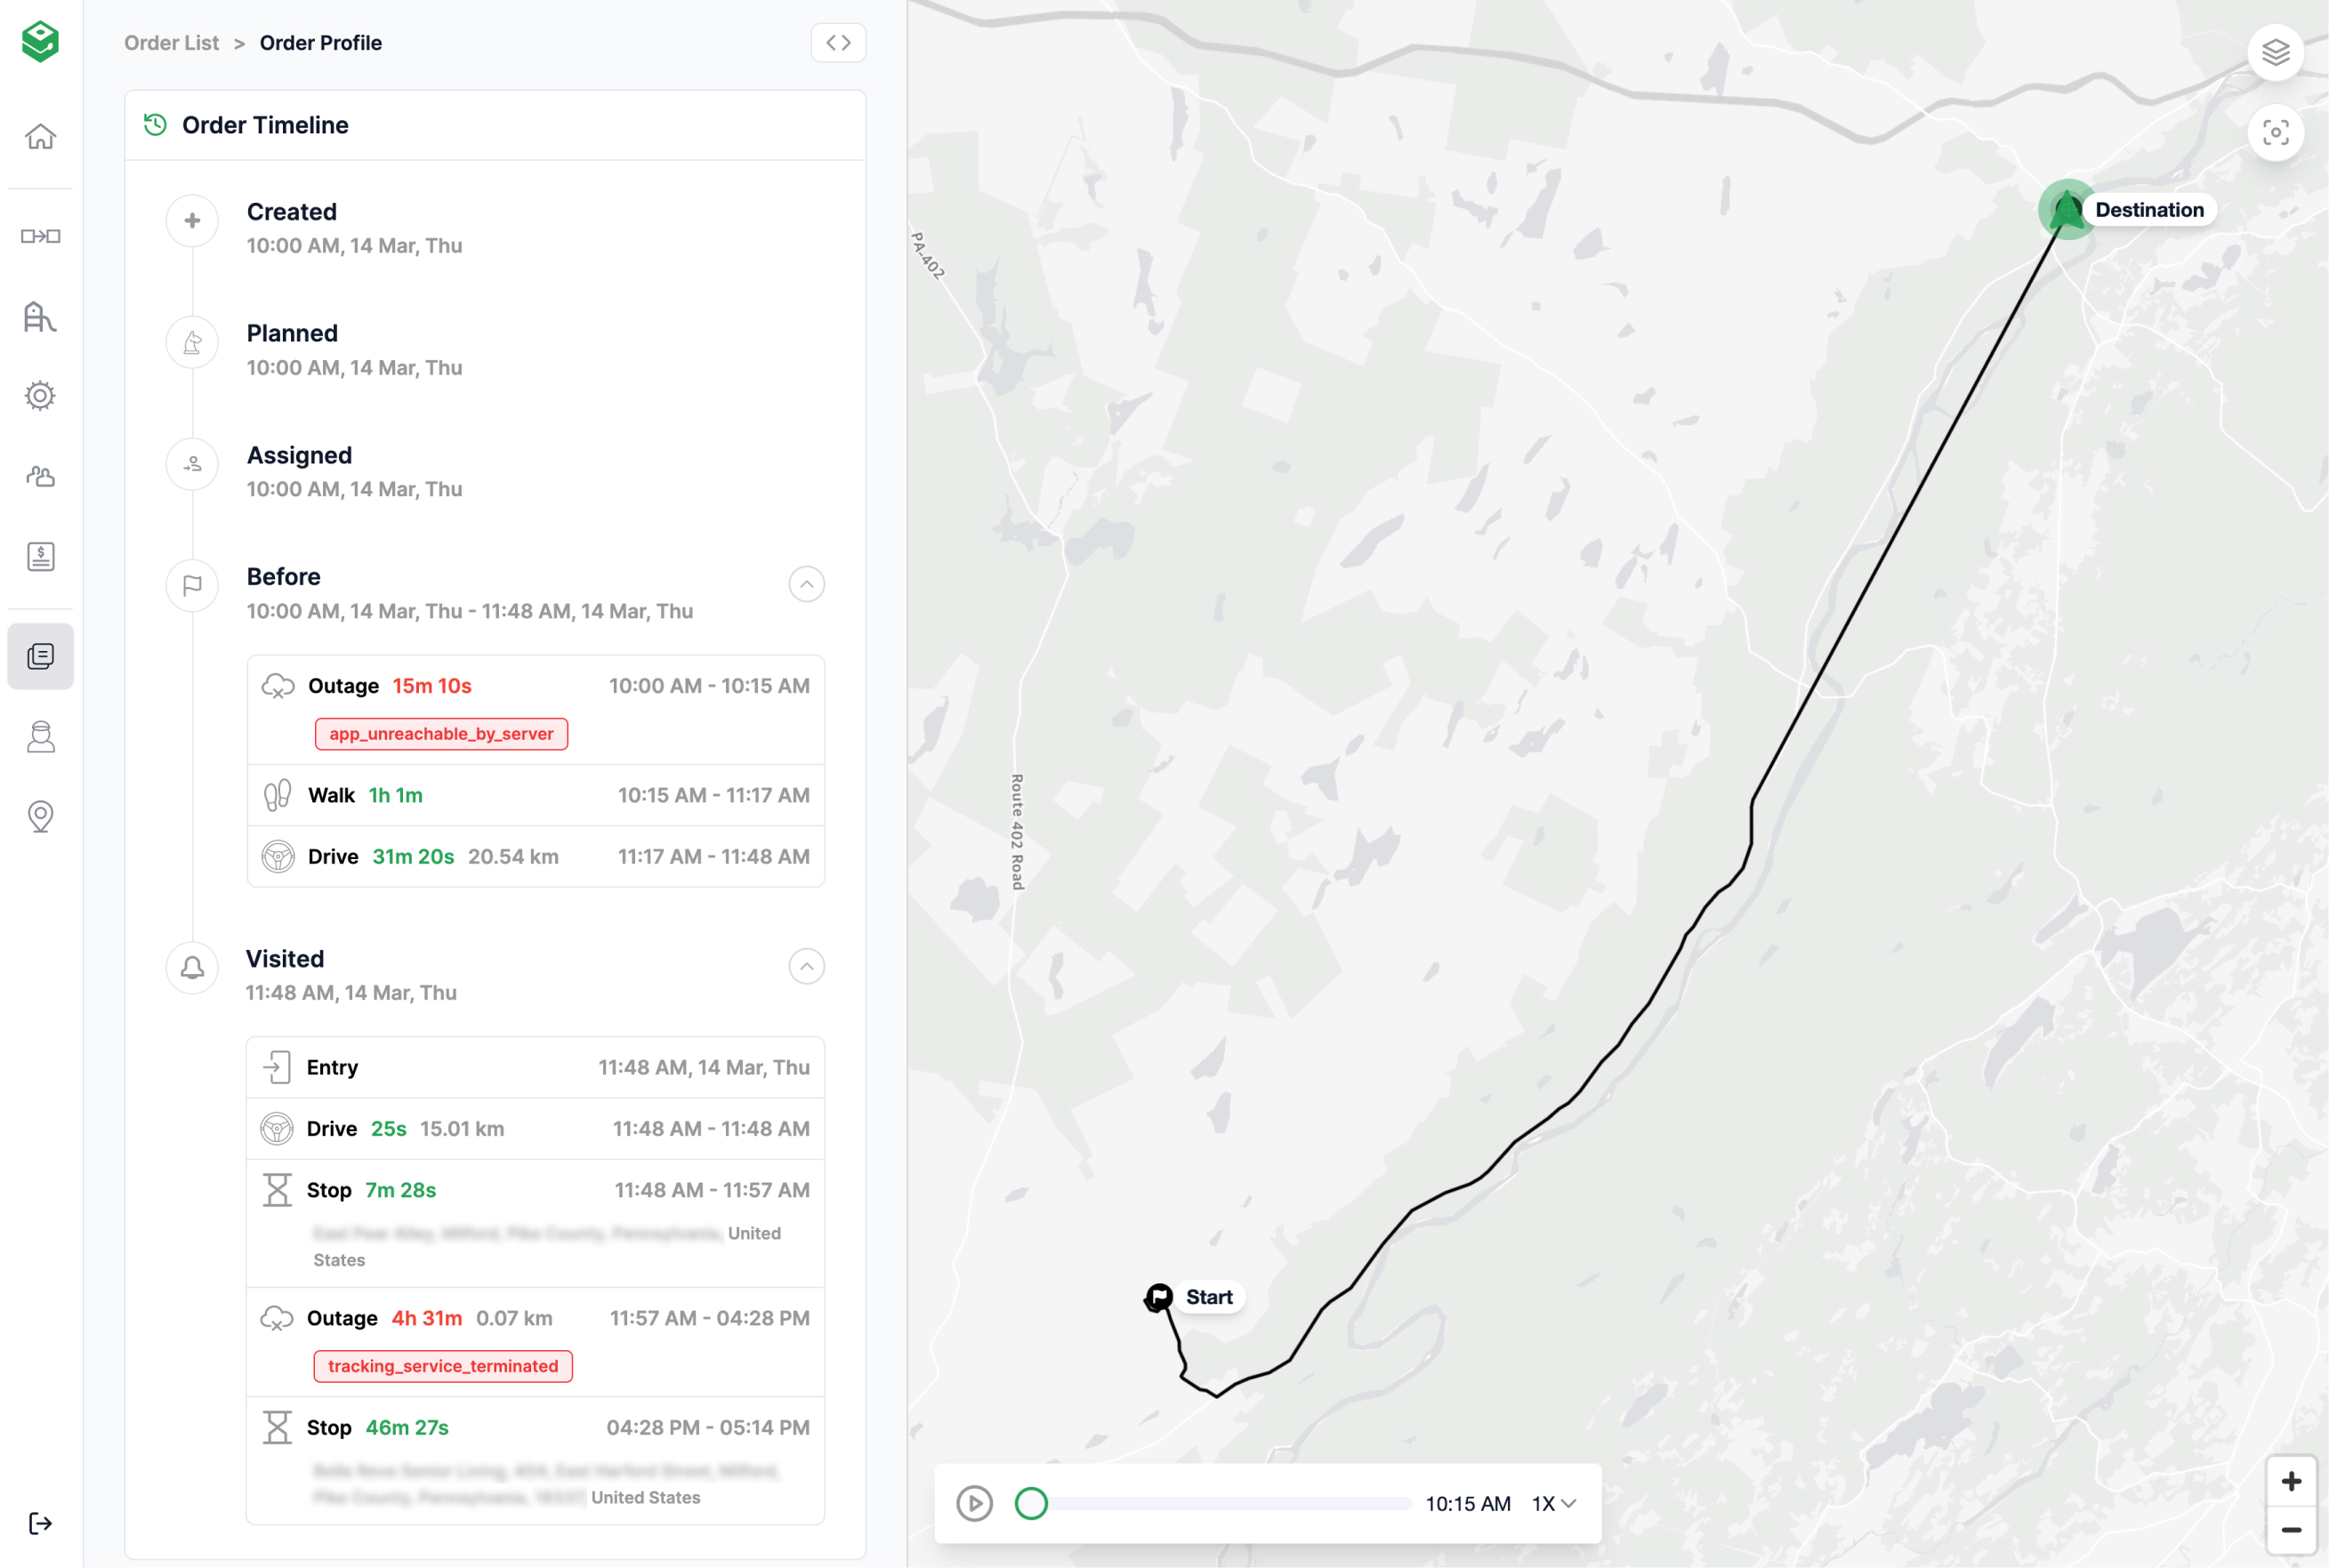
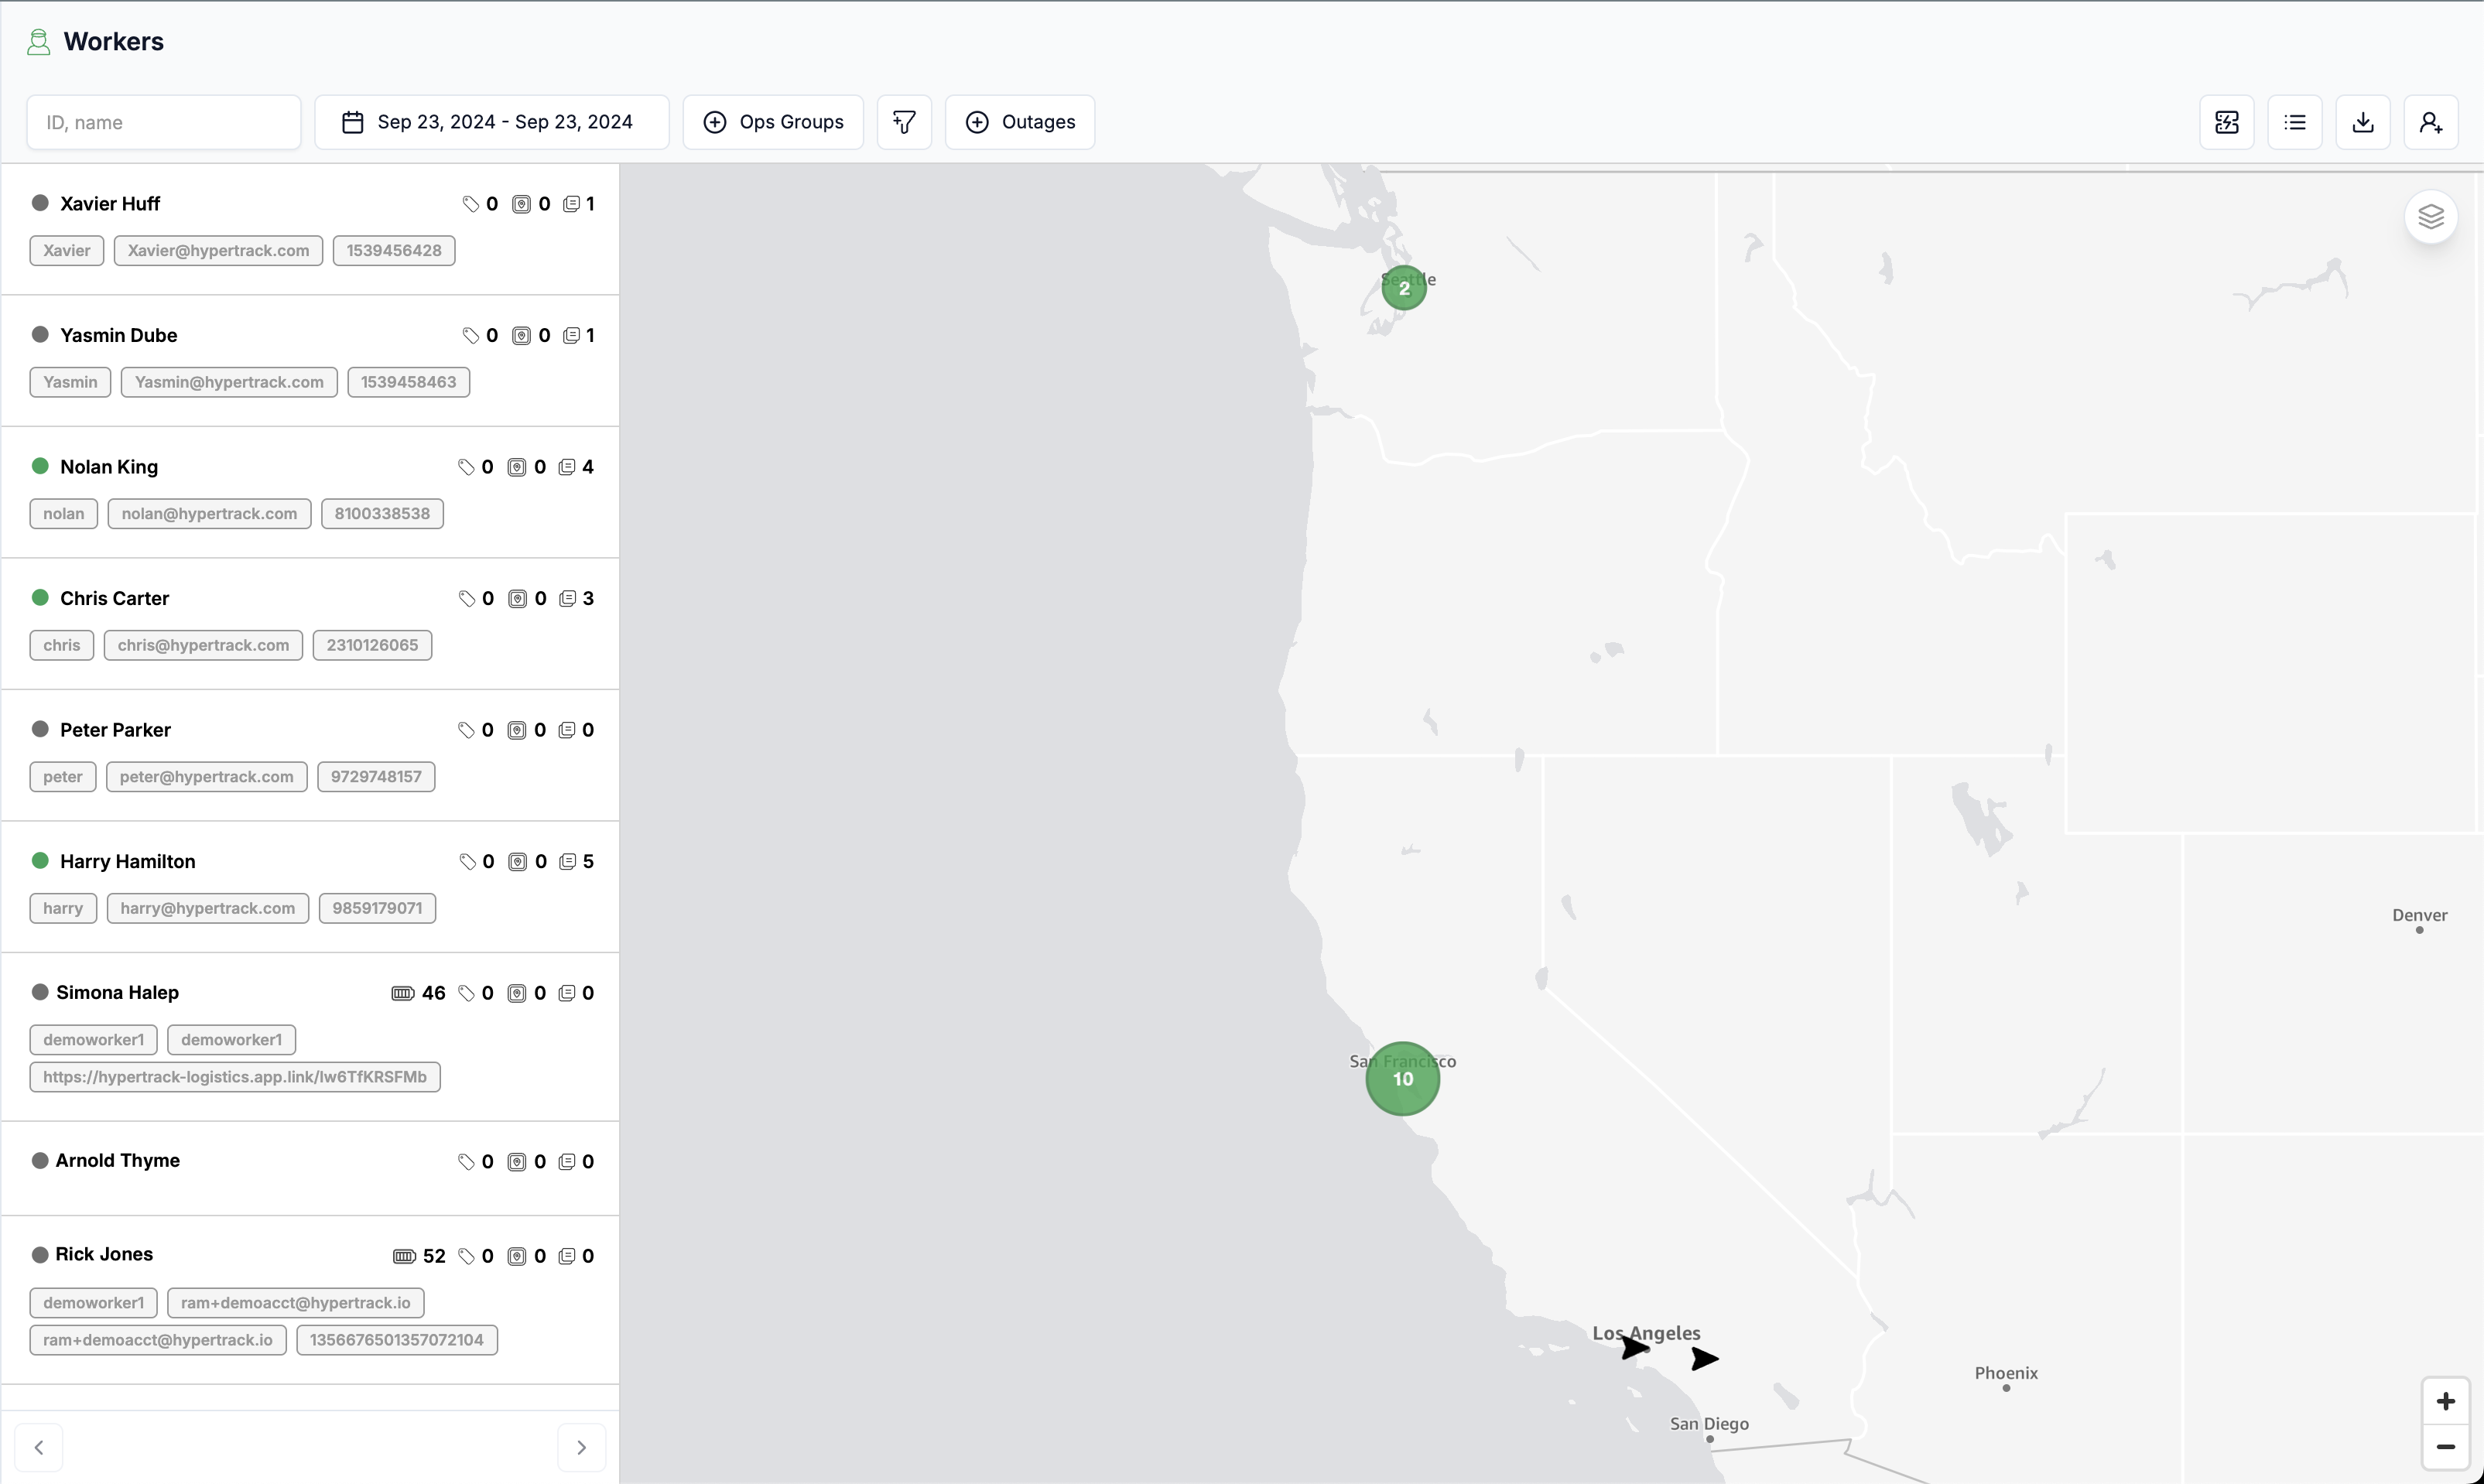
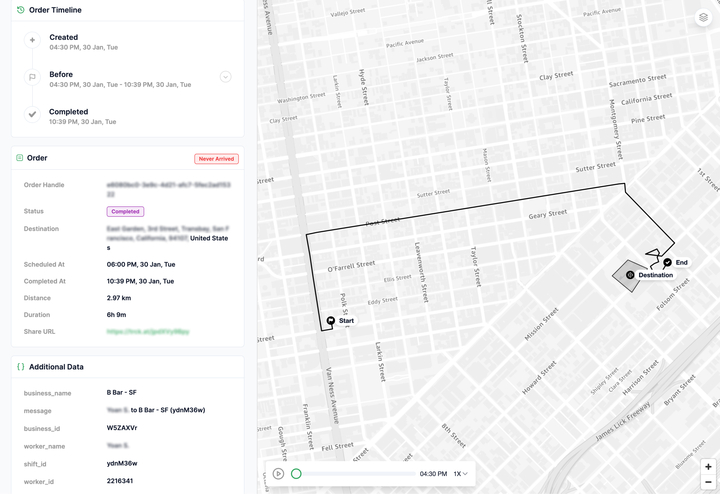
Scheduling and tracking field professionals is a complex interplay of technical coordination and user behavior. HyperTrack employs an orchestrated sequence of actions to wake up devices when work is assigned to a worker. HyperTrack's ability to bring ops visibility at the start of a tracking intent is unparalleled.
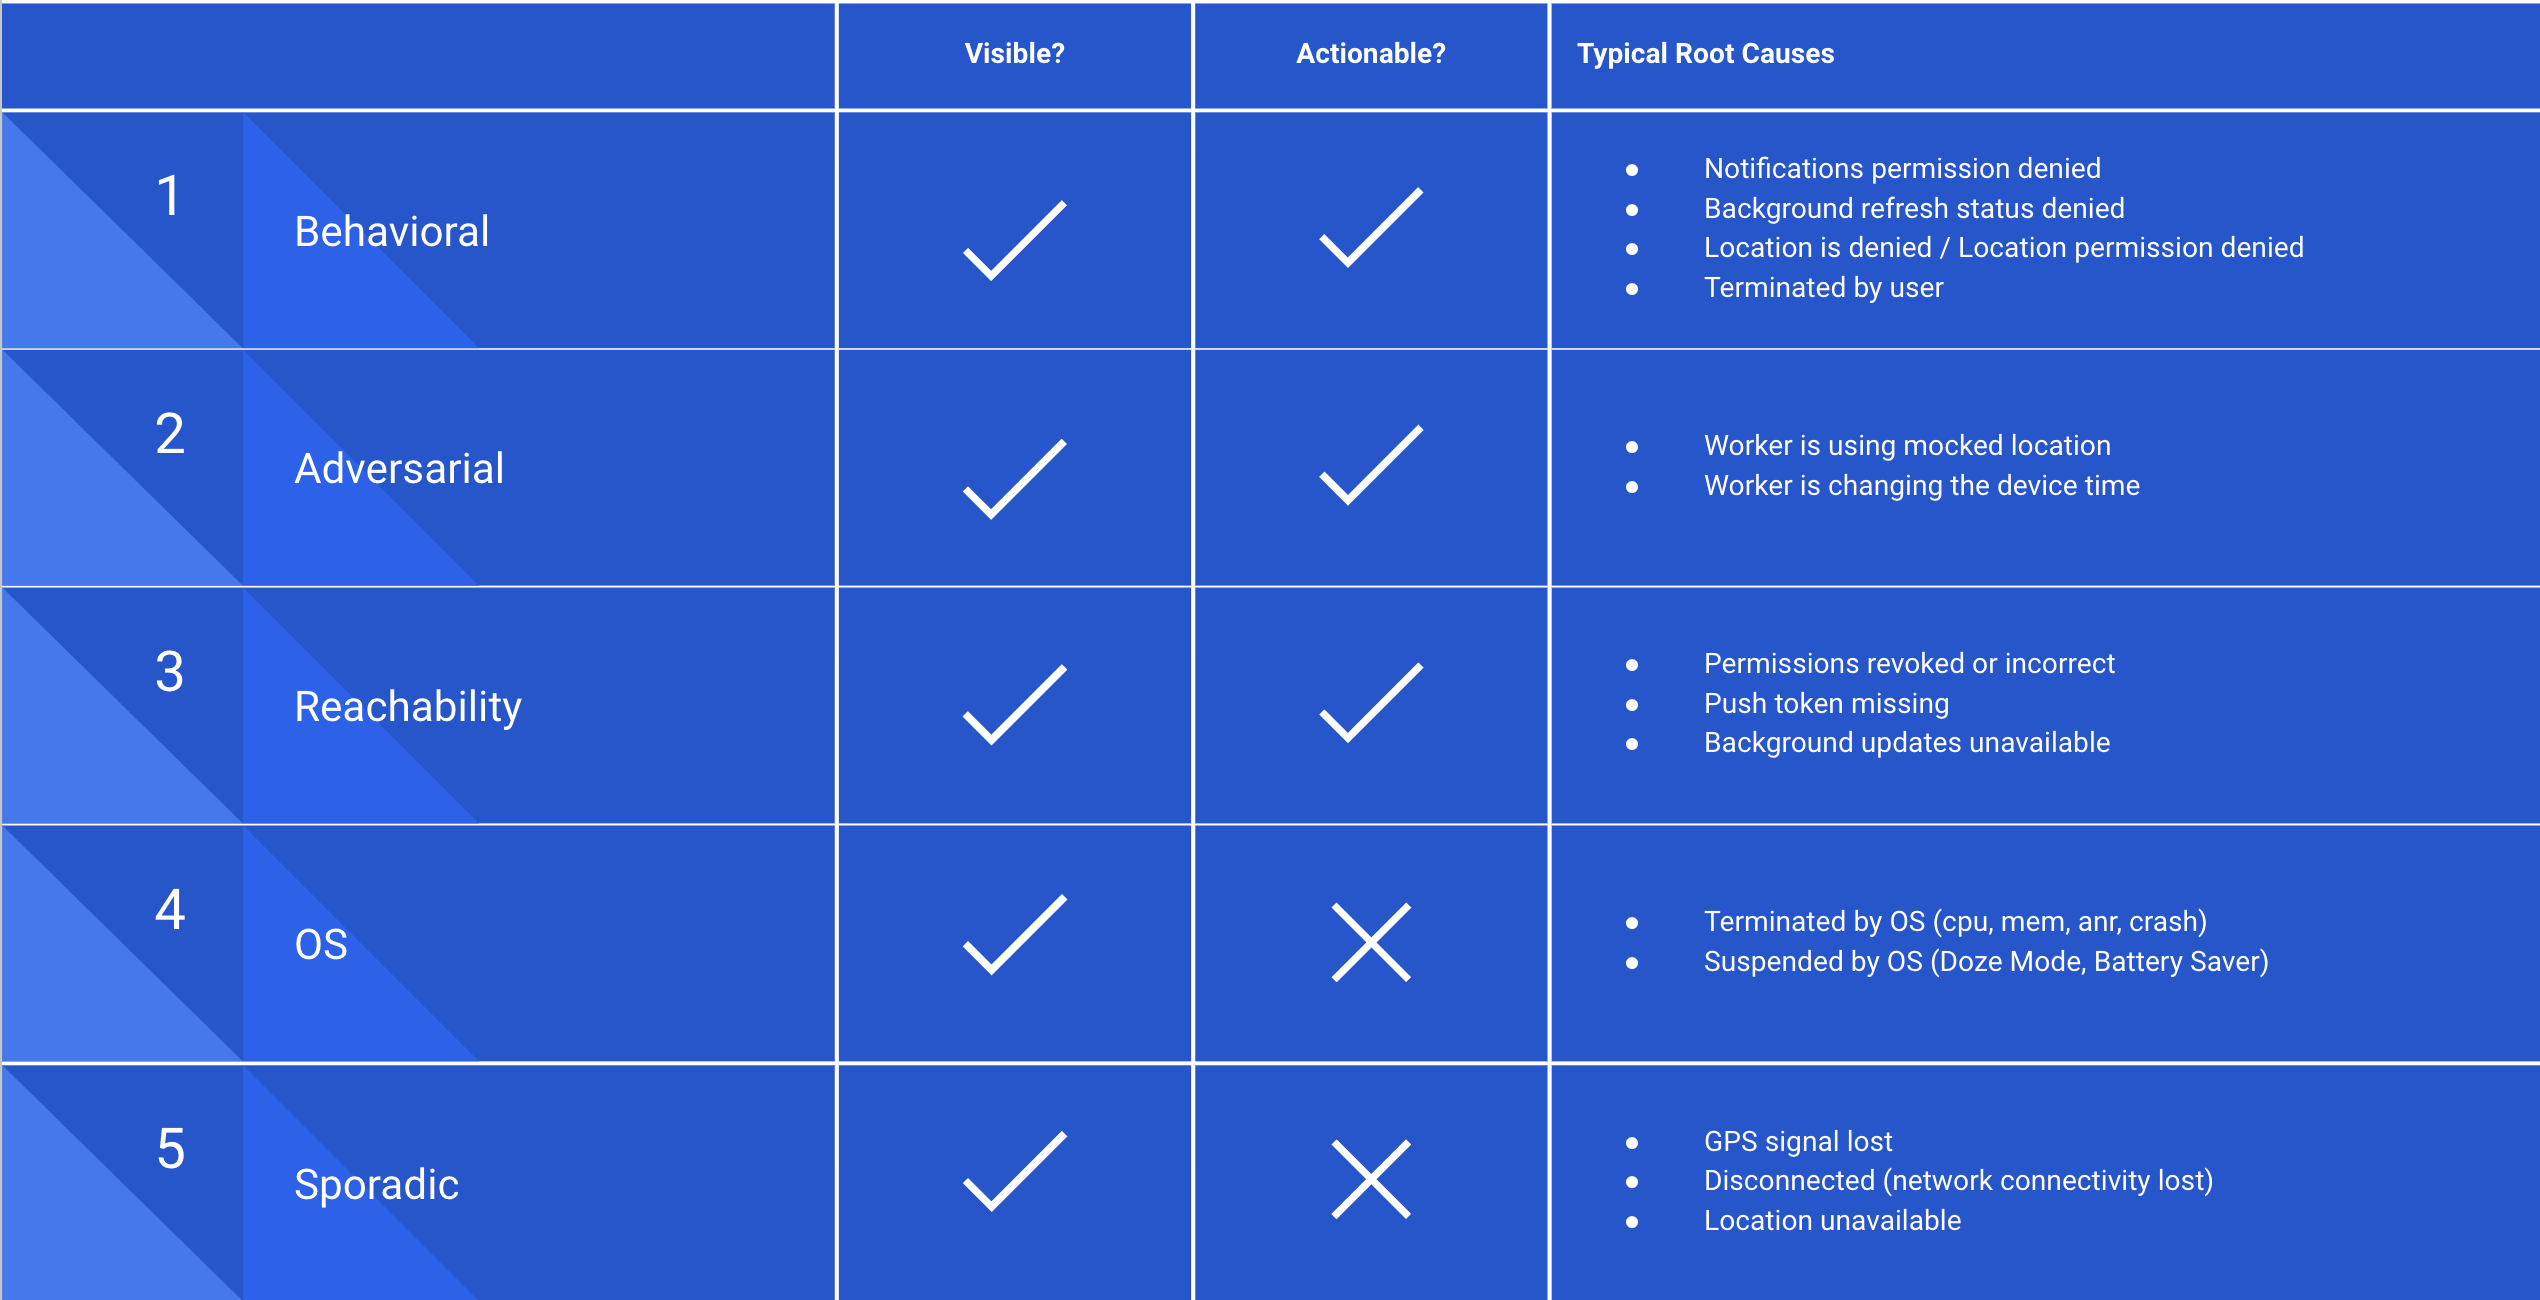
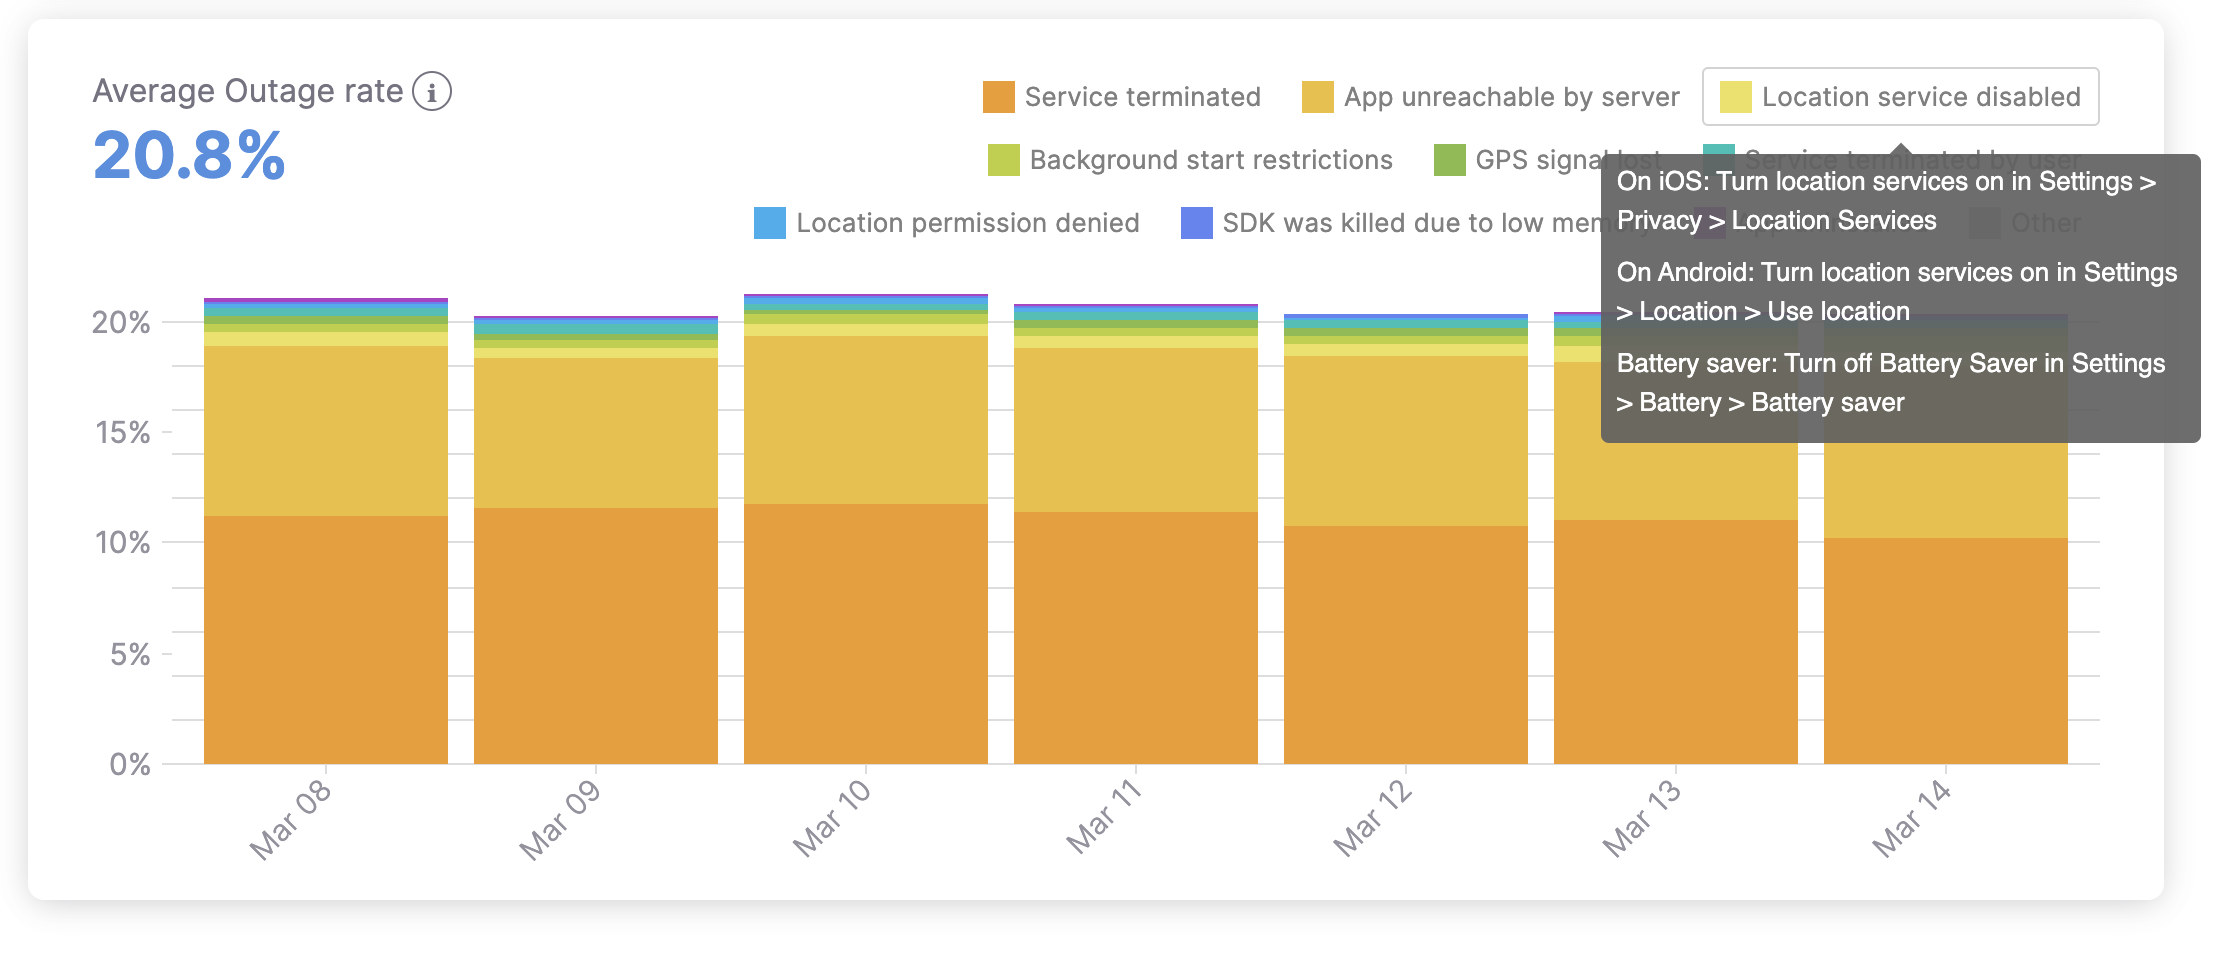
When accurate information about locations is unavailable, HyperTrack proactively identifies reasons for outages and helps triage the fleet's tracking health. We provide guidance on solving these issues and where there are no possible actions to influence the outcome, we provide visibility about the issue.
HyperTrack SDK consumes <1% battery per hour tracked
HyperTrack's patented tracking frequency modulation allows us to form an authoritative opinion on a device's location while preserving battery. If a device is stationary, our SDK does not emit information. If a device is moving or changing activity, the SDK sends across updated locations intelligently. Our primary tracking goal is to provide sufficient information density (in space and time) with minimal battery consumption.
Detect No-Shows

Use our risk detection to be aware of fraud, no-shows and other risks, or use our webhooks to build your own risk factors for your unique KPIs
Proactively Manage Exceptions
Escalations and are an inevitable part of operations. HyperTrack's features allow you to identify the best resources to handle an on-ground issue with flexibility.
Resolve Disputes with Trust
Automated payments based on distance traveled, time spent at work location and dispute resolution
Measure And Improve
Updated 10 months ago