Order Ops Views
HyperTrack provide different Order centric embeddable Ops Views.
Orders List/Map View
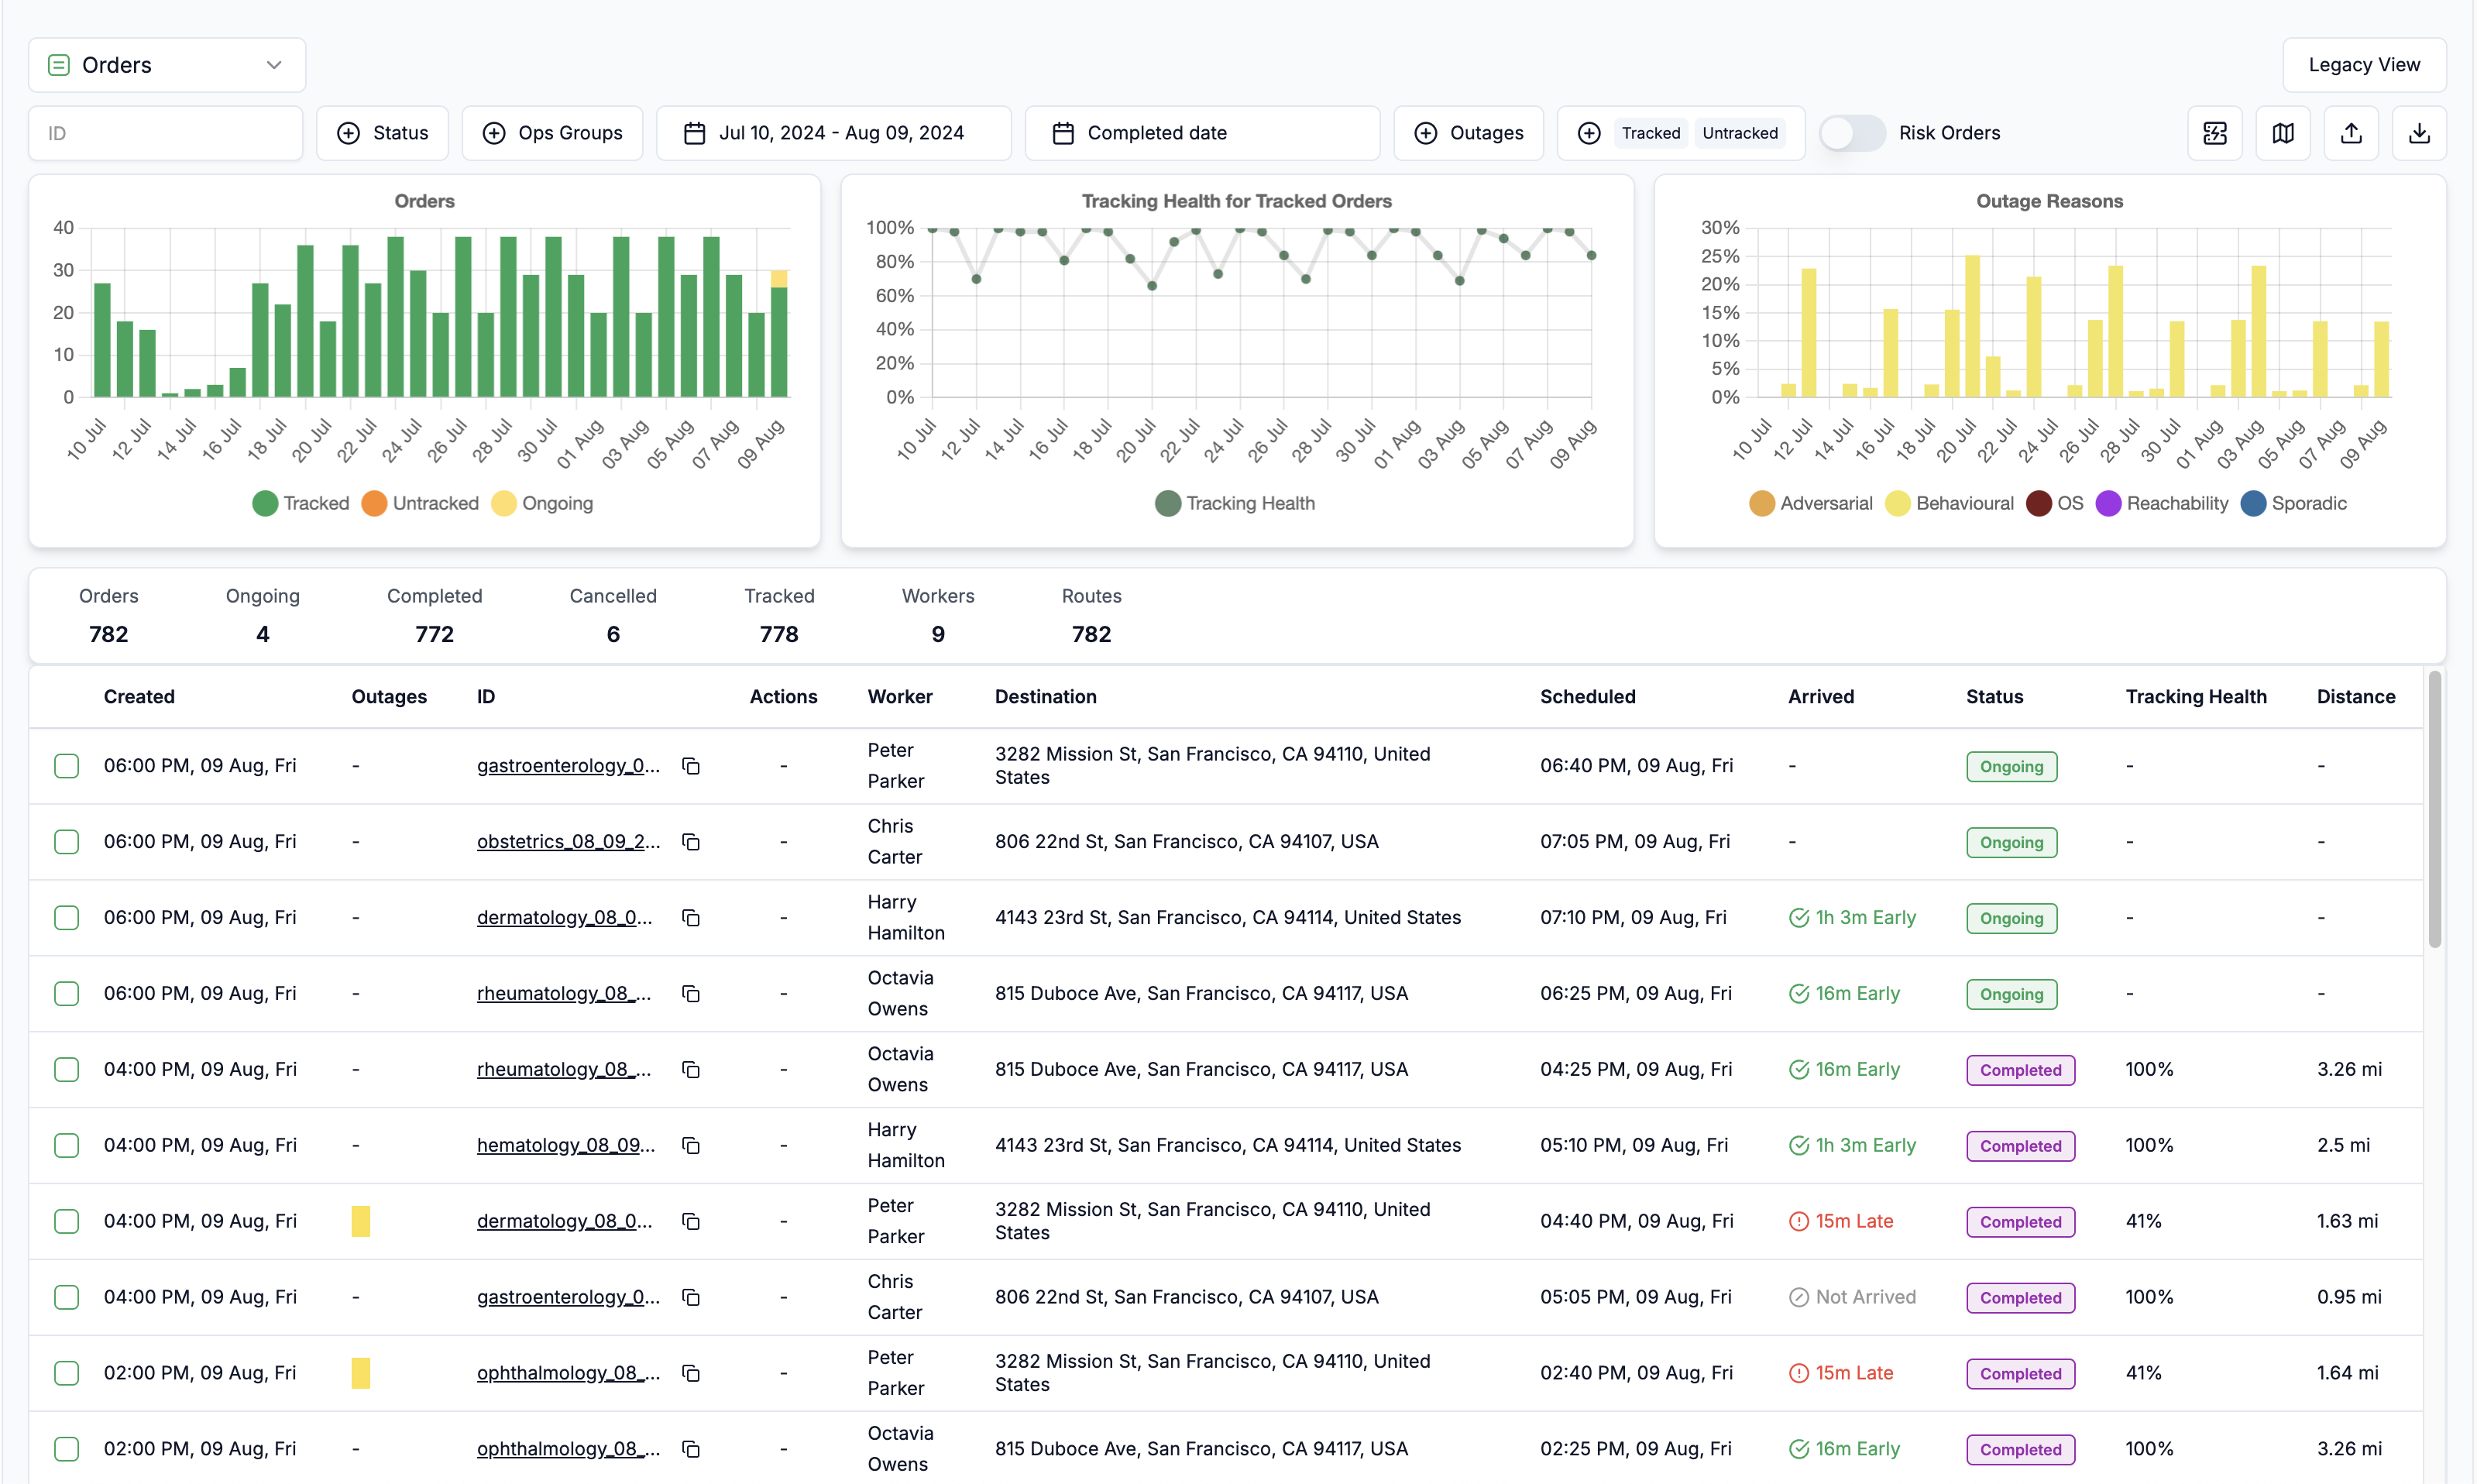
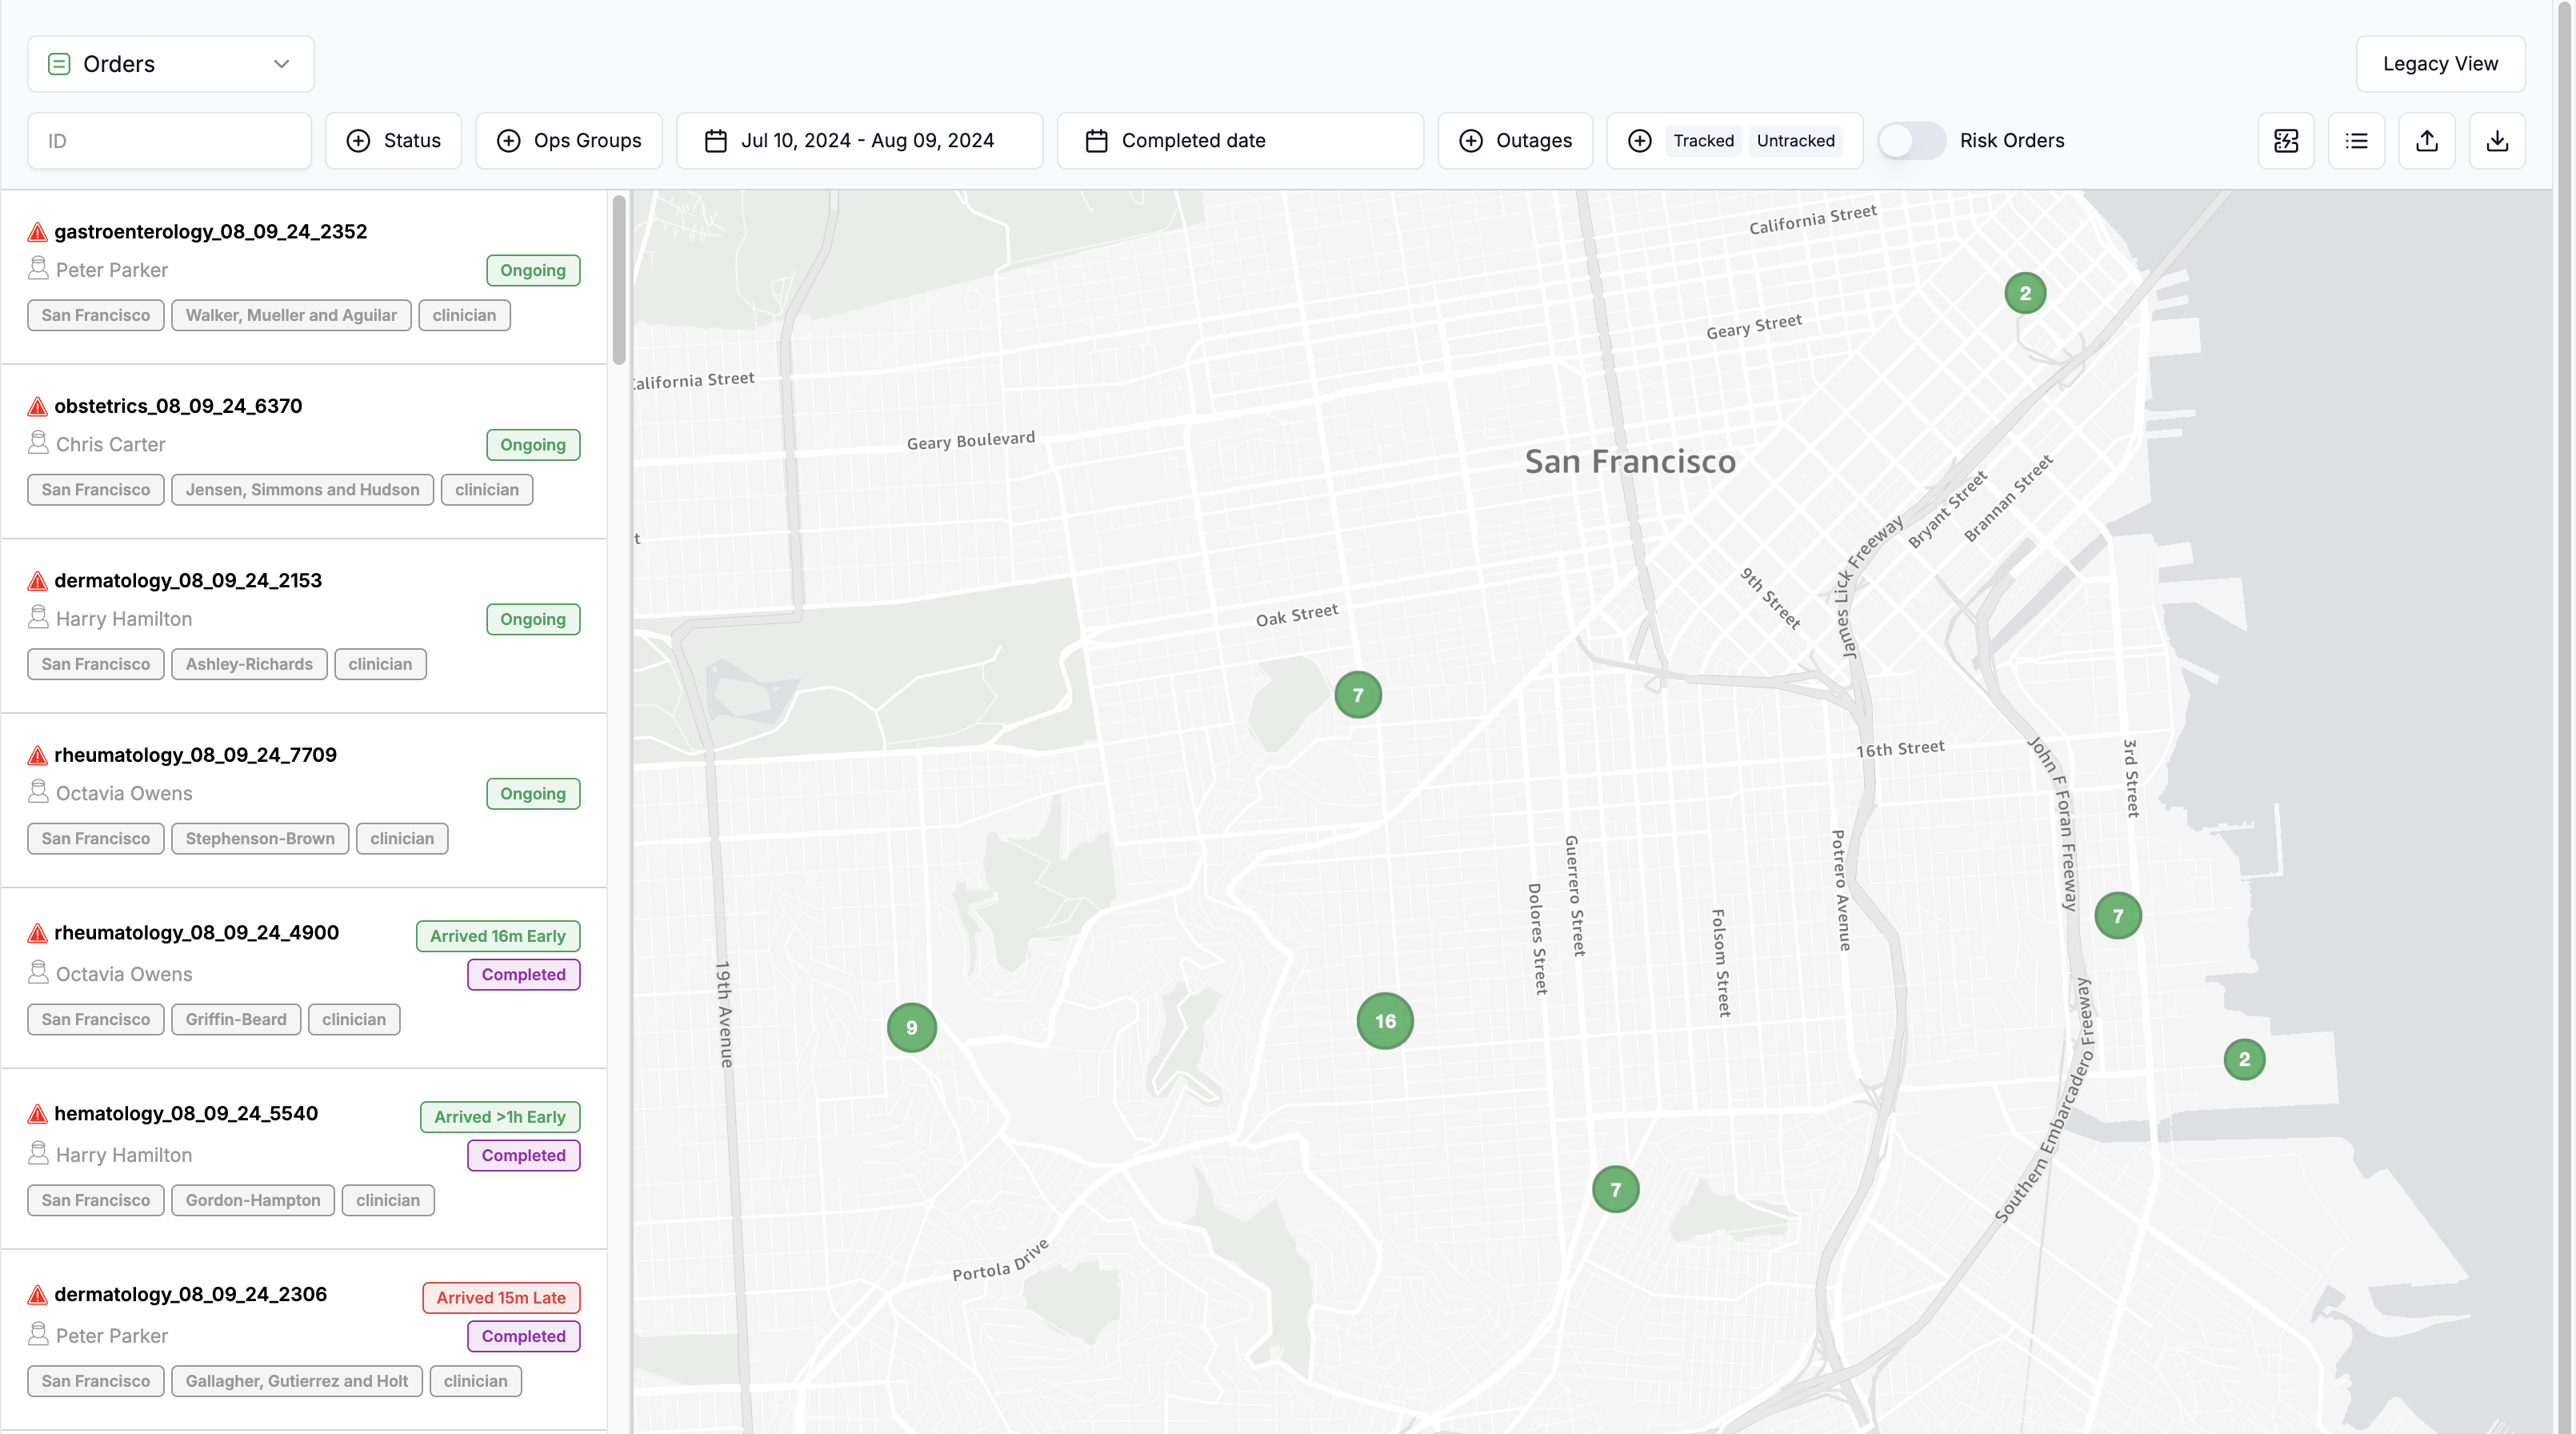
The Order list/map view provides all the orders in a tabular format or on a map. It provides powerful filters that allow Ops teams to slice and view segments of data based on schedule times, metadata, statuses, Ops Groups and much more. Once an Ops member has found the segment of data, they can export it to analyze the data further.
List View
Sample URL:

https://embed.hypertrack.com/views/orders?token=<token from OAuth API>&schedule-date-from=2024-07-10&schedule-date-to=2024-08-09
Map View
Sample URL:

https://embed.hypertrack.com/views/orders?token=<token from OAuth API>&schedule-date-from=2024-07-10&schedule-date-to=2024-08-09&order-view=map
Restrict views based on Ops teams
The Order List/Map view can be customized for your teams or customers. You can filter the data in these views based on the metadata provided for each order or operations group you've set up.
For instance, ops managers might need to see where their team members are, or you might want to create restricted views for different clients in an operations dashboard.
To achieve this, use the following encoded filter in the URL when embedding these dashboards into your web application.
// Get the URL filter programatically

// let obj = {"profile": {"zoneId": "1"}}
// let urlEncodedFilterStateString = encodeURIComponent(btoa(JSON.stringify(obj)))
// console.log(urlEncodedFilterStateString)

Example:

https://embed.hypertrack.com/orders?token=<token from OAuth API>&order-list-state=<urlEncodedFilterStateString>
📘 Your metadata can only have one layer of nesting and must be a valid JSON
Example - { "shift_id": 20240812 }
Your browser will most likely encode { } and : special characters, but when distributing embed URLs with a metadata_filter, be sure to encode your link. To read more about URL encoding, please read this guide.
Order Timeline View
The Order Profile view provides details of an Order along with the entire timeline of events that occurred during the lifetime of the order. The combination of the timeline and the map enables your Ops teams to deep dive into what, when, where and how the fulfillment of the order took place to help them triage and ensure business success.
A single order timeline view URL can be retrieved from Orders Track API from embed_urlfield inside orders object inside the response data. It comes in the following format structure as in example below:
https://embed.hypertrack.com/views/orders/alex_123_order_handle?publishable_key=<publishable_key>&source=orders&fulfillment_attempt=0&route-handle=c7f7aebc-b6c7-4e15-b234-6f913bb17d5a"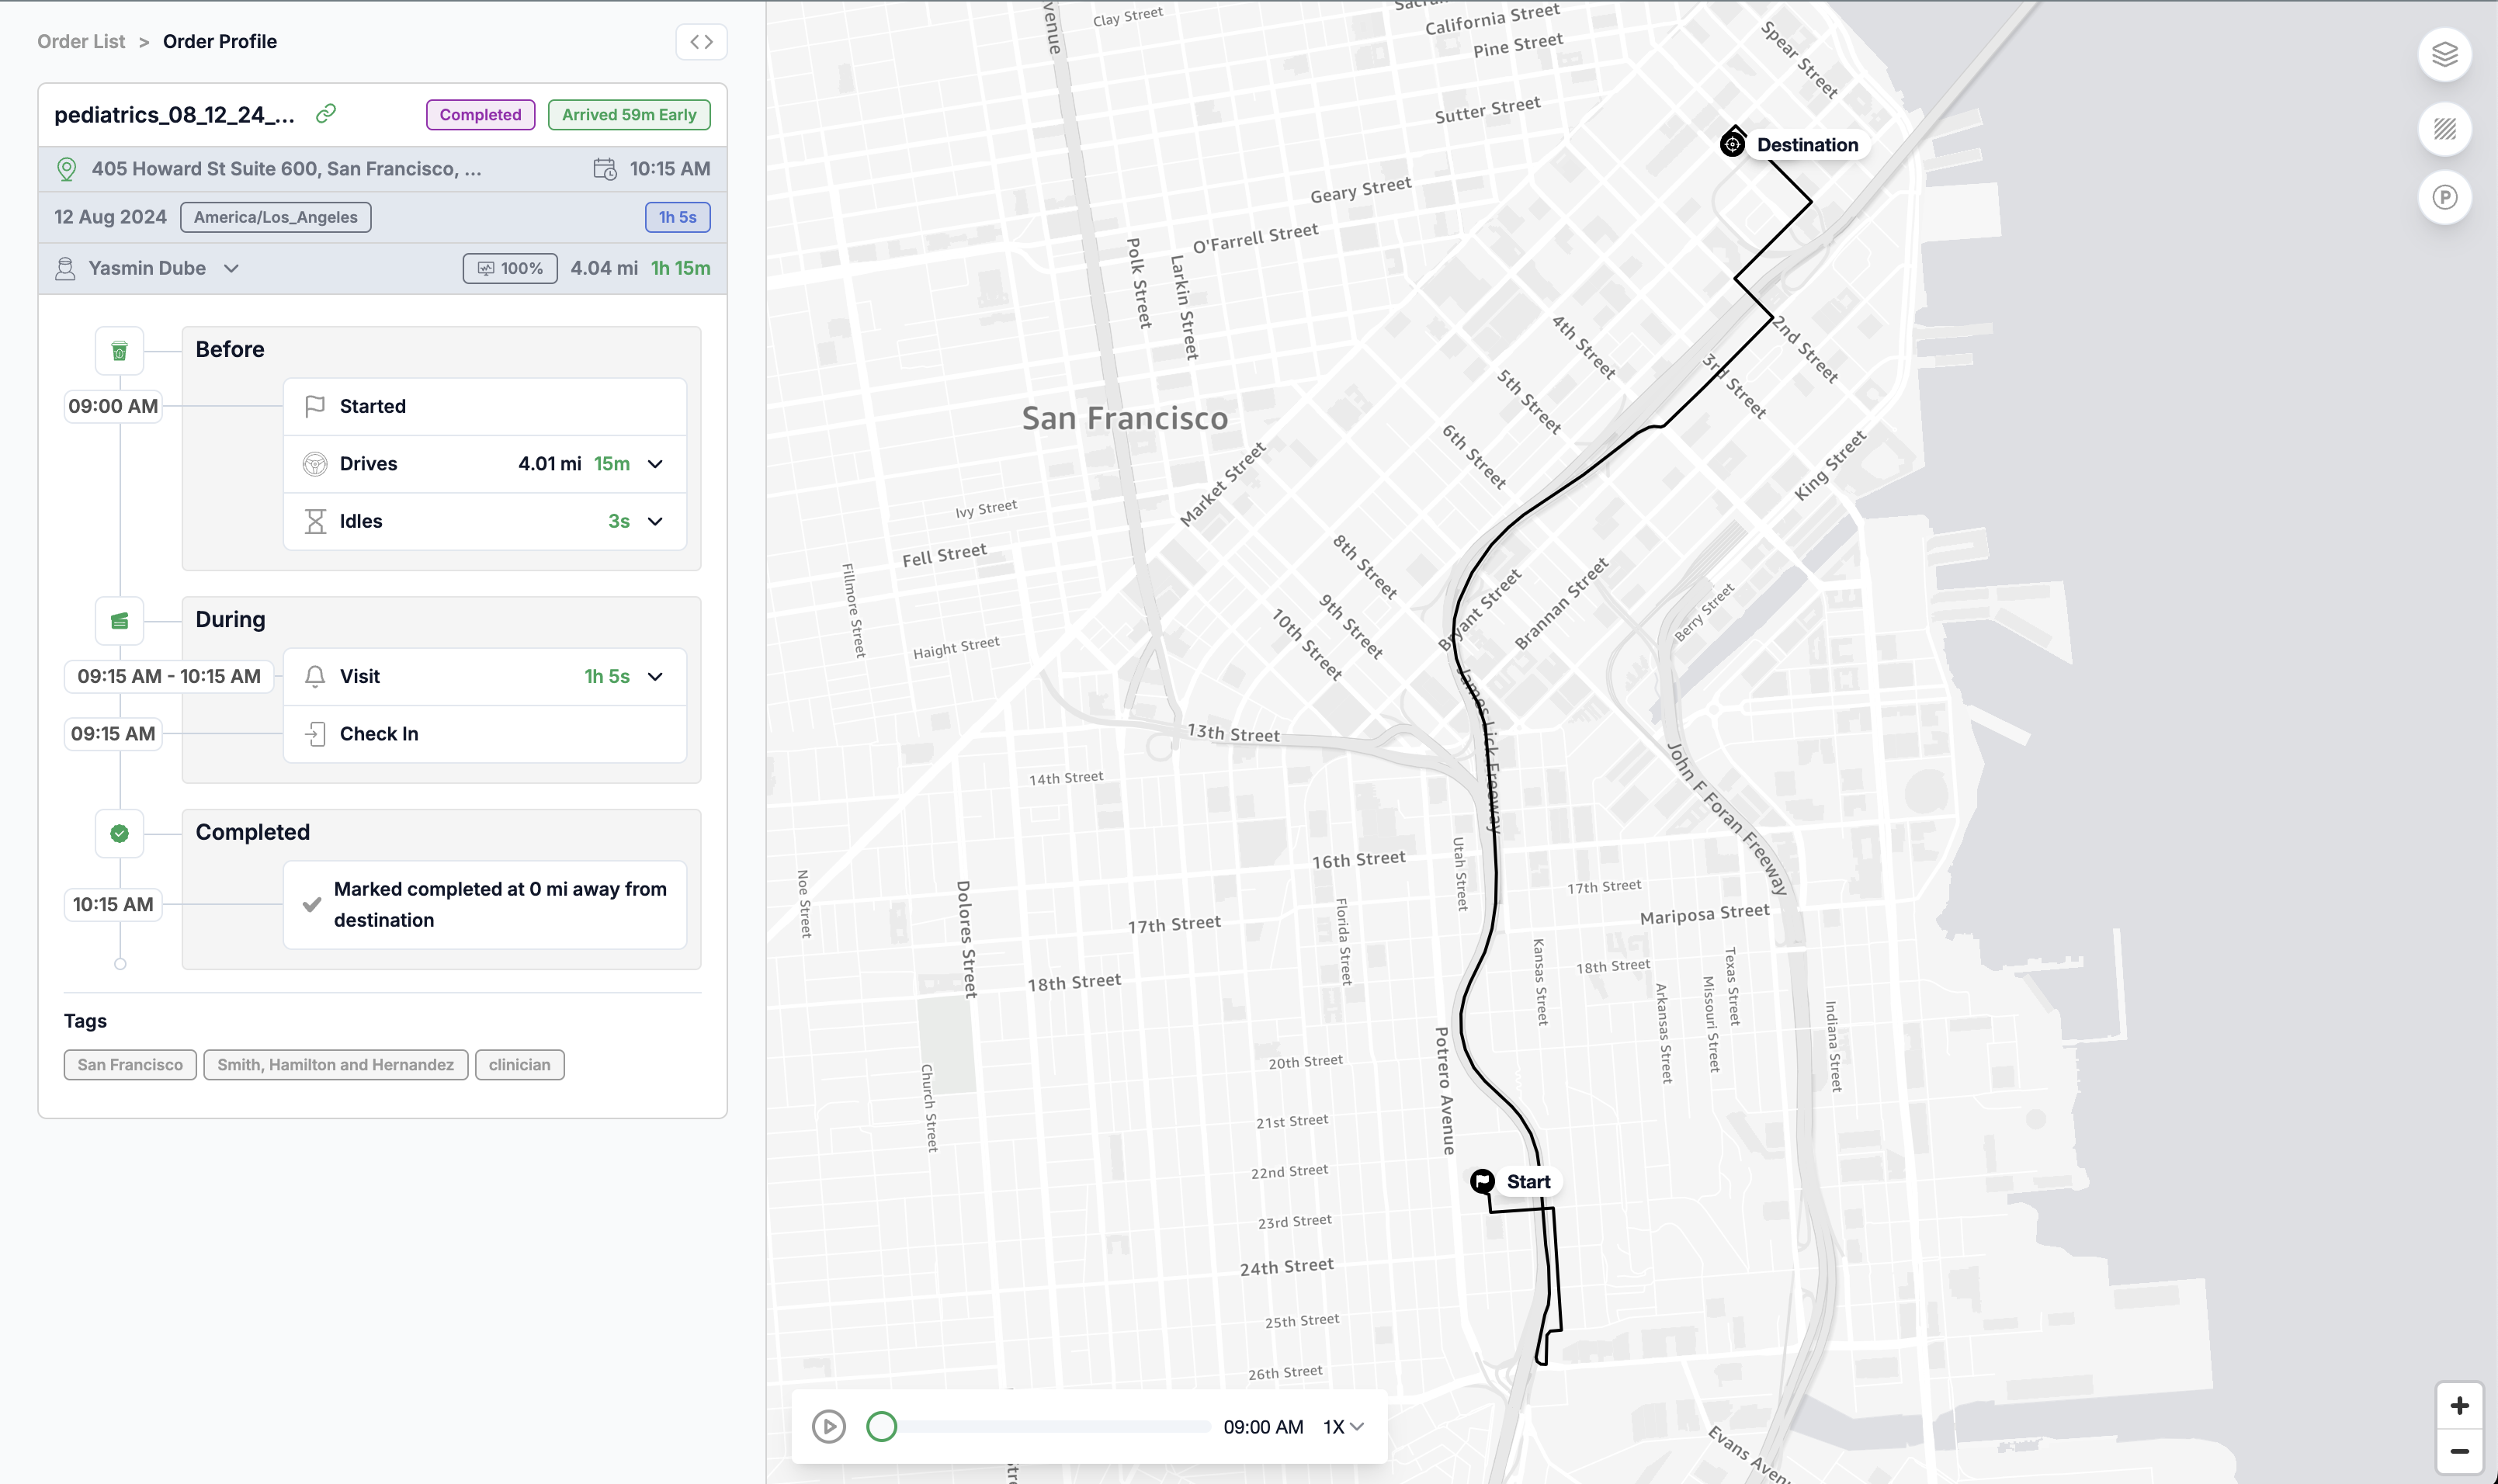
Order Analytics
It's important to ensure that all your orders are being tracked as expected through the HyperTrack platform. In order to provide this visibility, we provide aggregated metric charts in your Order Ops List view that can help you look at trends over the past 60 days.
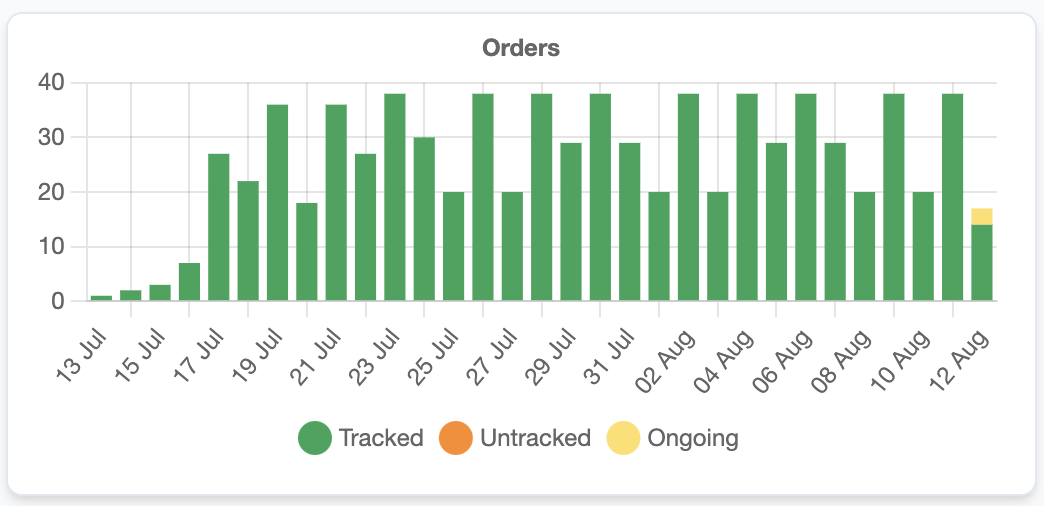
Orders Chart
This chart offers a daily snapshot of successfully tracked versus untracked orders within the selected time range. It’s crucial to keep the untracked count low, aiming for a tracked order rate close to 100% to ensure your teams have full visibility into all field activities.
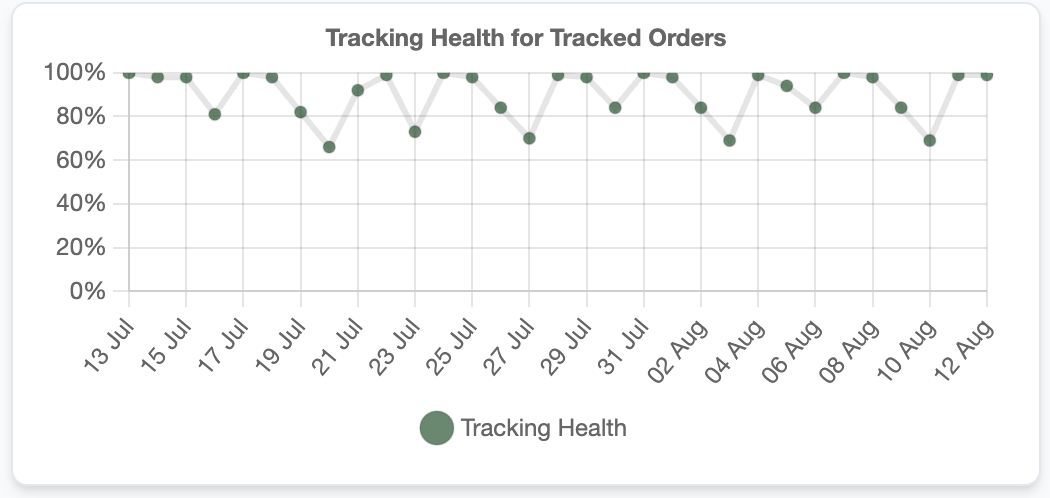
Tracking Health Chart
This chart provides the score of how well your orders tracked considering the subset of order that tracked. A high tracking health score ensures that during the lifetime of your orders, sufficient ground truth was available to help your Ops teams have visibility.
Outages Chart
This chart provides the day-wise split of outages that impacted your Orders. These outages have been distributed within buckets to reflect the cause. Learn more about the different outages here.
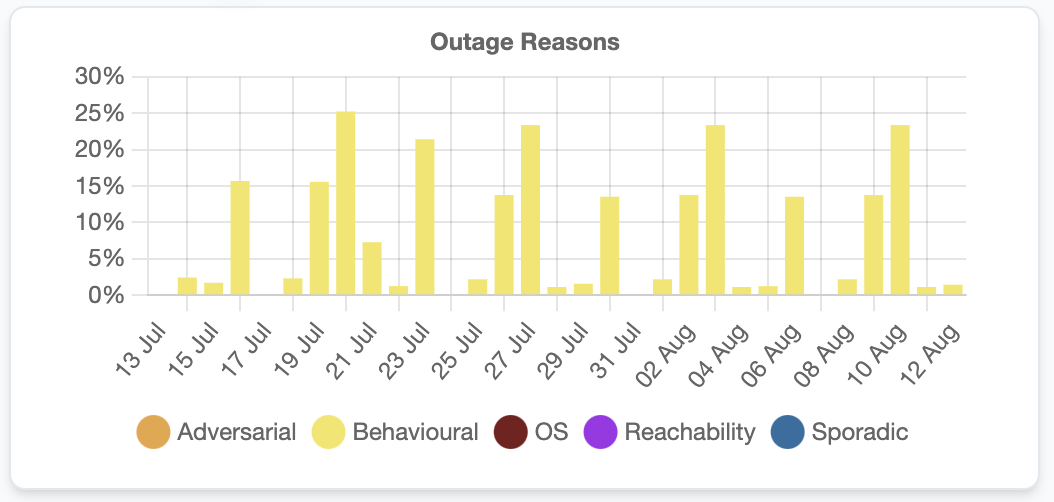
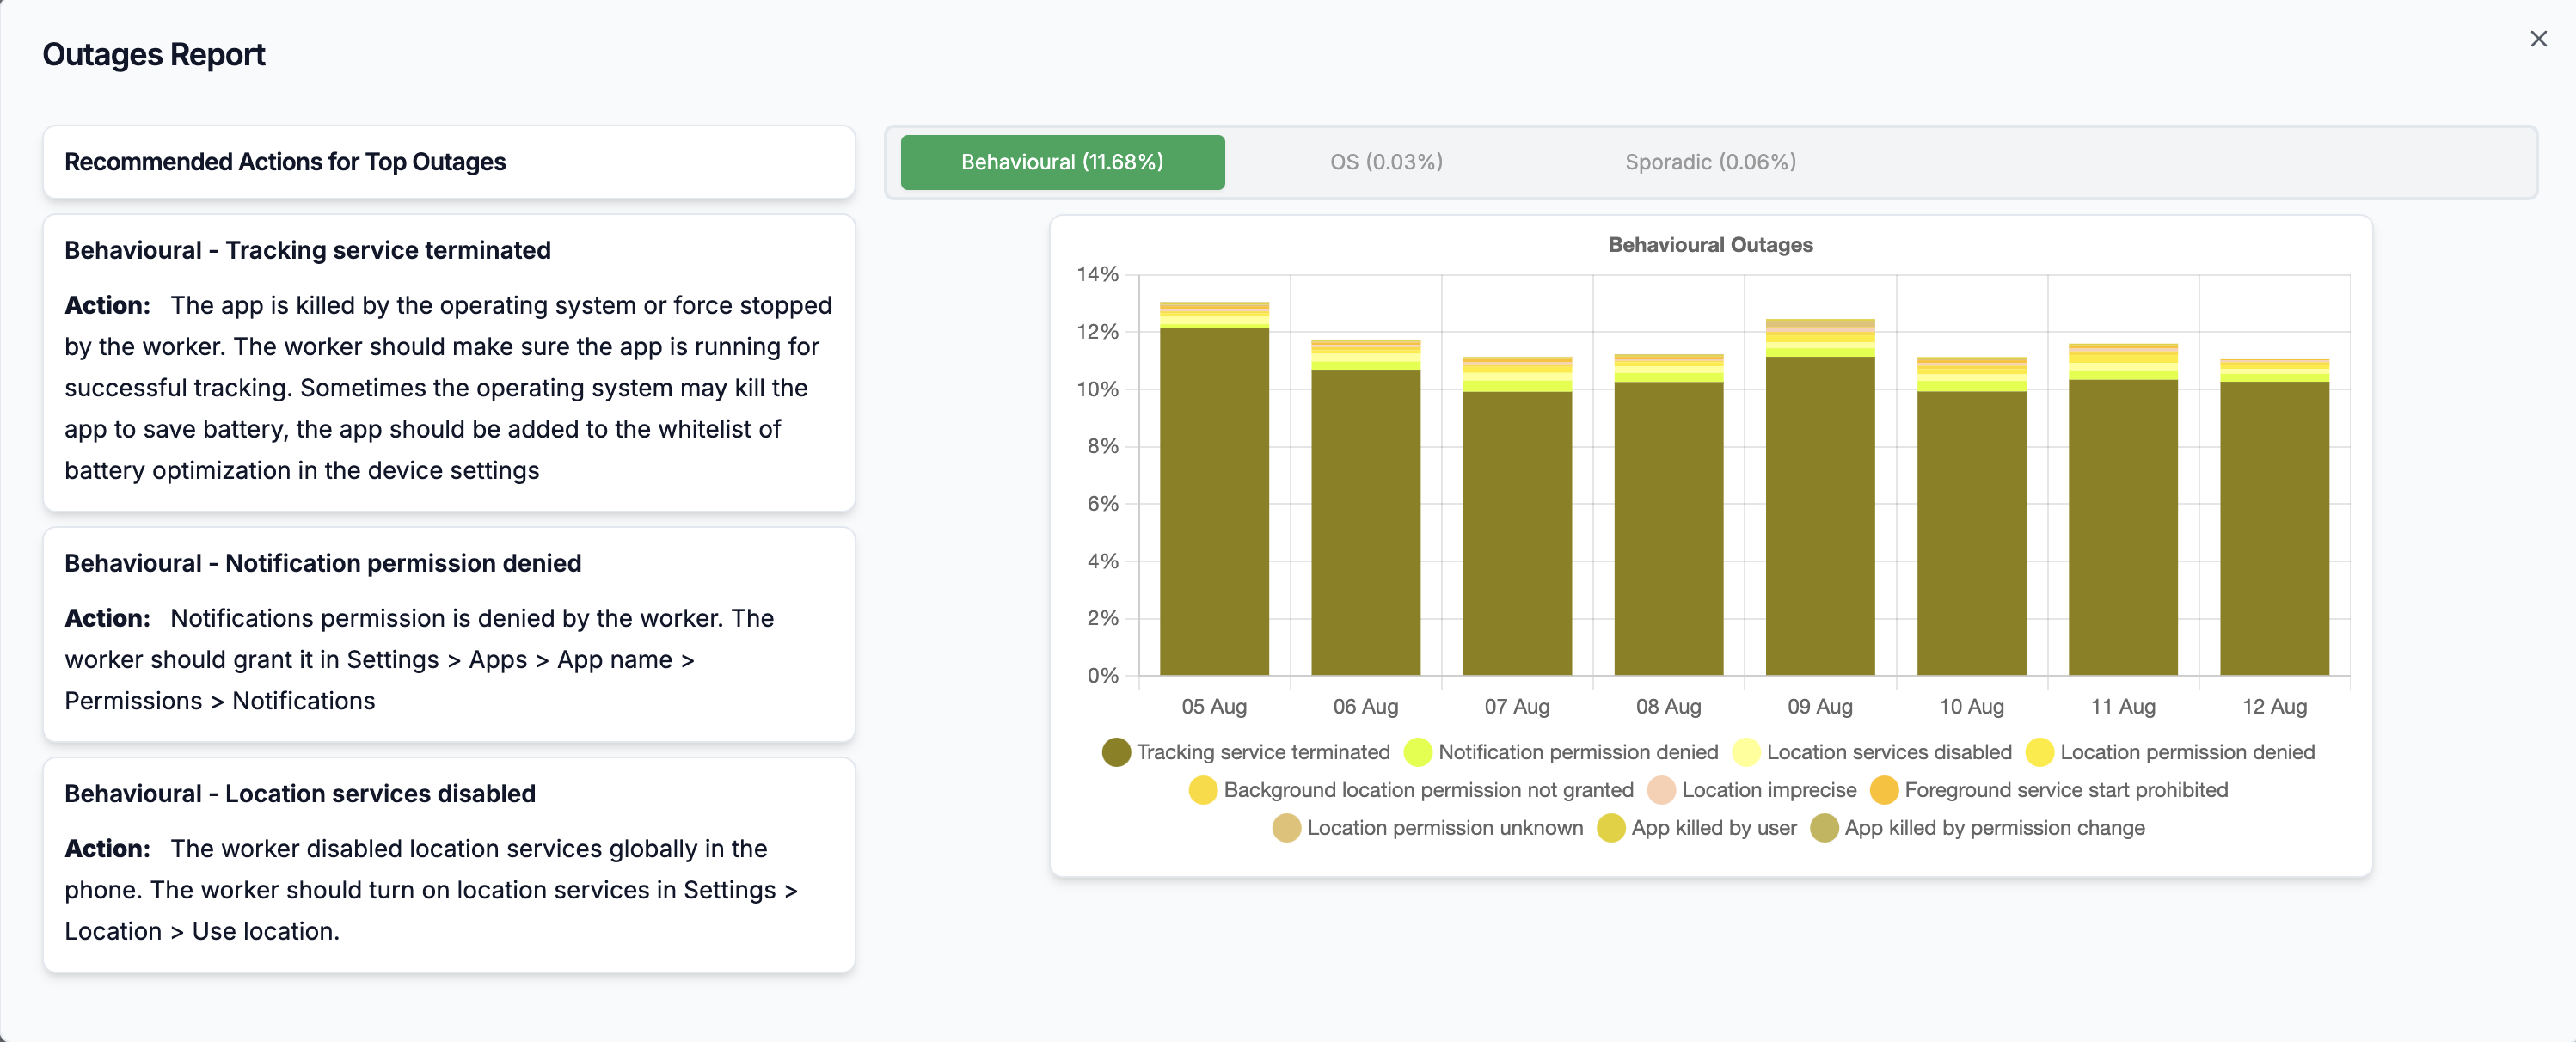
In addition, we provide an action report that helps you quickly identify the top impacting outages and the steps you need to take to resolve them.
Embed Customizations
We provide the ability to customize, show and hide elements in our embeddable Order Ops view. Each of the options can be provided as URL parameters to configure your custom embed experience.
Parameter
View
Values
Description
show-drivers
Map View
true/false
Displays driver locations on the orders map.
map-only
Map View
true/false
Displays the map only view with all orders loaded.
hide-header
Map/List View
true/false
Hides the page header
hide-controls
Map/List View
true/false
Hides the entire controls section. For more fine-grained control, see the options below:
hide-search
Map/List View
true/false
Hides the search bar
hide-filters
Map/List View
true/false
Hides the orders filters (ie, status, completed date selector, scheduled date selector, ops group filter, risk orders, tracked/untracked filter & outages filter)
hide-view-switcher
Map/List View
true/false
Hides the button to switch between the map/list views
hide-order-export
Map/List View
true/false
Hides the button to export orders
hide-order-import
Map/List View
true/false
Hides the button to import orders
hide-outages-report
Map/List View
true/false
Hides the button which shows outages report for orders
hide-charts
Map/List View
true/false
Hides the aggregate charts
hide-summary-card
Map/List View
true/false
Hides the summary card of orders
order-list-state
Map/List View
Base64 encoded string
Base64 encoding of a JSON object with fields described below
order-list-state.driver_handles
Map/List View
Array of strings
List of driver handles to filter orders by.
order-list-state.profile
Map/List View
string
JSON / JSON PATH string for profile (metadata) values to filter drivers by.
JSON PATH can be used for applying an "OR" clause to metadata filters. For example, passing:"$ ? (@.c1 == \"New York\" | @.c2 == \"San Francisco\" \\ | @.c3 == \"London\")" as the value of profile will filter all orders that have one of the 3 metadata values set.
status
Map/List View
string
Comma separated string of Order statuses - ongoing, completed, cancelled, planned, unplanned, disabled. e.g status=ongoing%2Ccompleted
Example usage for order-list-state
let obj = {"profile": {"country": "USA"}, "driver_handles": ["driver-1", "driver-2"]}
let urlEncodedStateString = encodeURIComponent(btoa(JSON.stringify(obj)))
console.log(urlEncodedStateString)
This snippet would output: eyJwcm9maWxlIjp7ImNvdW50cnkiOiJVU0EifSwiZHJpdmVyX2hhbmRsZXMiOlsiZHJpdmVyLTEiLCJkcml2ZXItMiJdfQ%3D%3D
The output can be passed in as the value of the order-list-state Query param.
Order Timeline Embed Customizations
| Parameter | View | Values | Description |
|---|---|---|---|
| hide-worker-details | Timeline view | true/false | Hide worker details from timeline info card on right on the order Timeline. |
| show-visits-only | Timeline view | true/false | This parameter limits the view of the worker's timeline to the location of the visit destination only. See this [section](### Facility manager's view customization) for more details. |
| map-only | Timeline view | true/false | Displays the map only view with in order timeline view. |
| hide-bookmark | Timeline view | true/false | Will hide top header on right side on above timeline card. This will hide embed button, share url button and breadcrumbs. |
| hide-links | Timeline view | true/false | Removes the quick links to Worker Timeline and Place View above the timeline. |
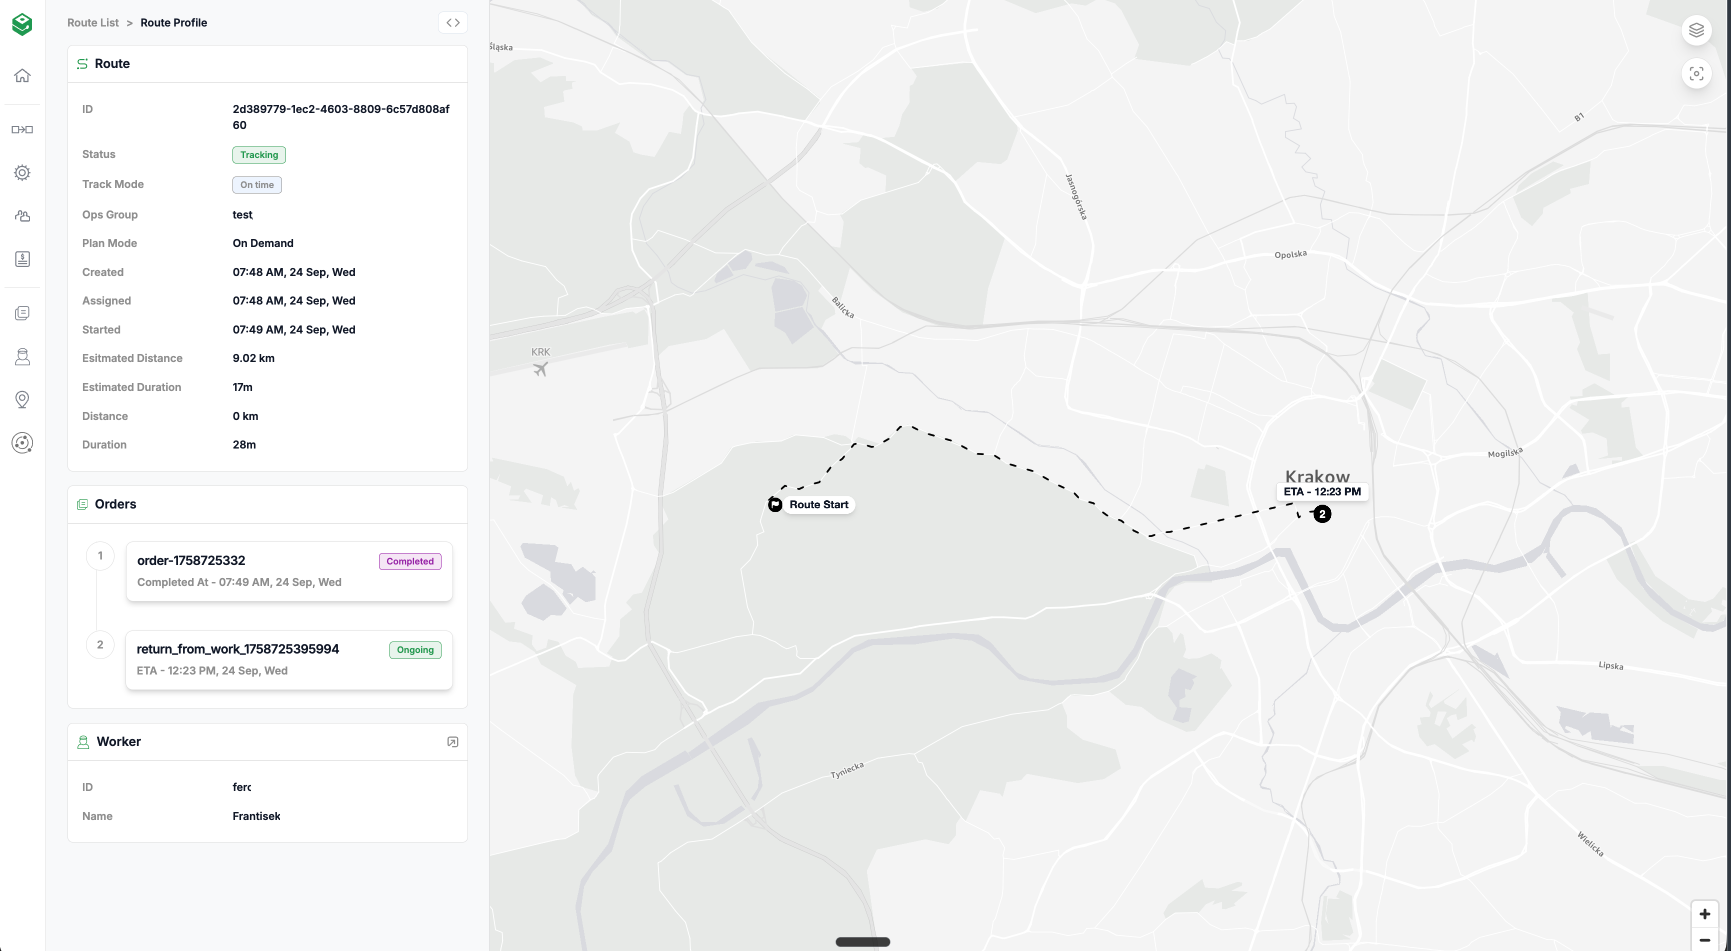
Route View
The Route view is an embeddable view that provides the details of all the Orders that are being worked on by a Worker on a given day. When your use case requires Workers to visit multiple locations to complete a job, the Route view can provide visibility into the different legs of the journey of an individual worker for the job.
// Sample URL that can be used to embed the Route view in an iFrame
https://embed.hypertrack.com/views/routes/<route_handle>?token=<token from OAuth API>